


Now that Donald Trump and Hillary Clinton have all but secured their parties’ nominations, what’s the best way to look at how their matchup is most likely to turn out?
In the past, political scientists and economists have used economic growth models to predict presidential election results. The overall record of this methodology has been fairly good. The book jacket blurb of a 2009 volume by UCLA political scientist Lynn Vavreck, The Message Matters, epitomized this confidence:
The economy is so powerful in determining the results of US presidential elections that political scientists can predict winners and losers with amazing accuracy long before the campaigns start.
The following figure shows how well the so-called Fair model—named for Yale economist Ray C. Fair, whose 1978 research paper famously postulated a link between economic events and votes—has done over time.
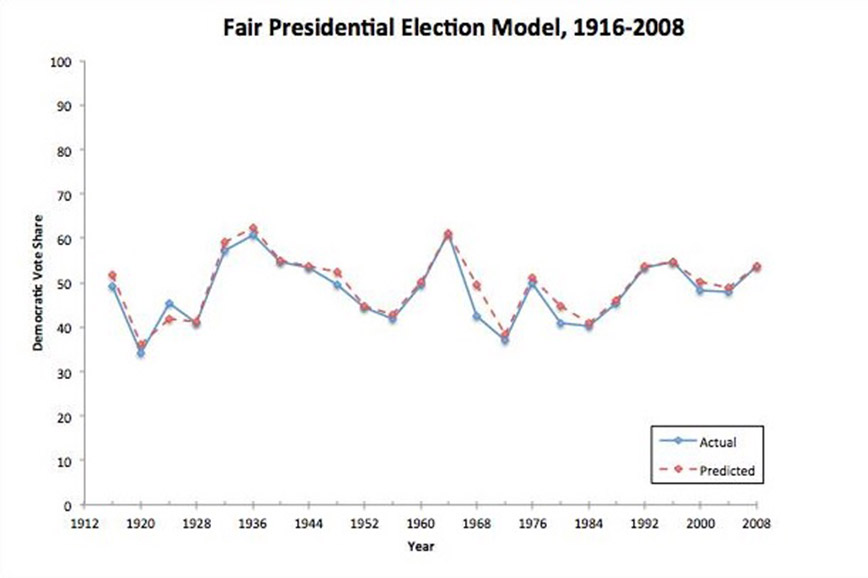
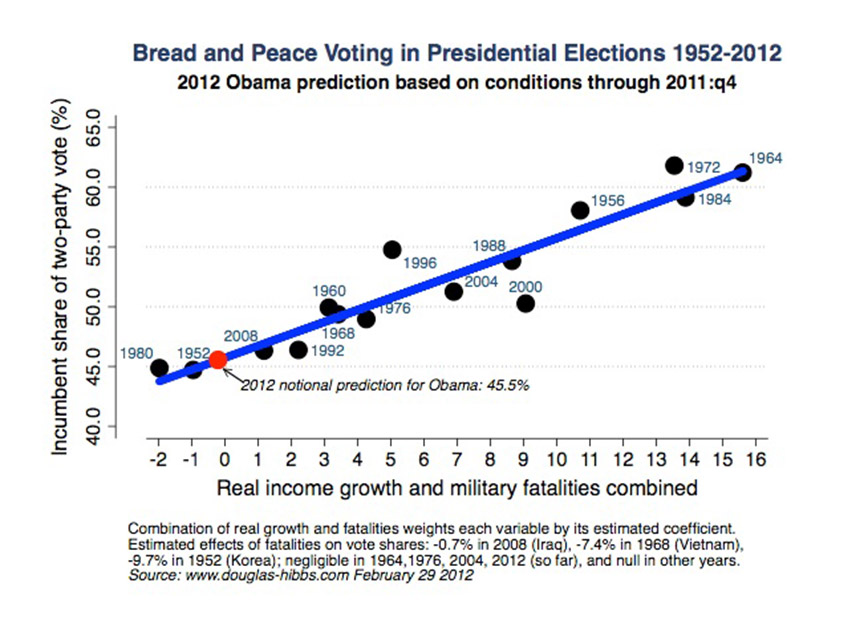
Then came the 2012 re-election of Barack Obama. Fair’s predictive model missed the Obama victory, as did another one, the well-regarded “Bread and Peace” model created by political scientist Douglas A. Hibbs Jr. That model’s intriguing name comes from its two variables. They are, in Hibbs’s words, “weighted-average growth of per capita real disposable personal income over the term, and cumulative US military fatalities due to unprovoked, hostile deployments of American armed forces in foreign wars.” Here’s how the Hibbs model performed in 2012:
Why the model missed the mark is beyond the purpose of this essay, but essentially, in close elections the results can fall within what academics call “the error term”—a statistical cousin of polling’s “margin of error”—and therefore predict the wrong winner.
Ray Fair’s 2012 model estimated that Obama would garner 49 percent of the popular vote. Obama collected 52 percent, well within the error margin.
Amid the United States’ current slow-growth environment, the economy alone will not determine the winner.
In part this is because partisans will differ in their perception of the economy (see next chart). Recent surveys show a similar pattern of partisan evaluations of how well the economy is doing. In early 2016, more than 50 percent of Democrats believed the economy was getting better while only 14 percent of Republicans thought it was improving—with independents being closer to Republicans than Democrats.
YouGov Survey 2009-2012: Overall, do you think the US economy is getting better or worse?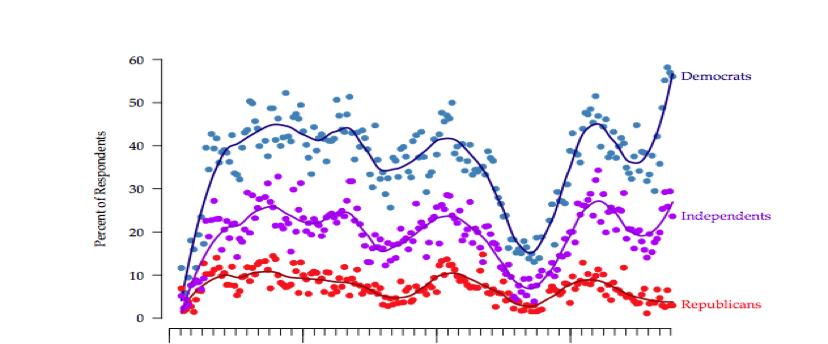
Fair’s economic model for 2016 combines the growth rate of real per capita GDP minus the growth rate of the GDP deflator, plus the number of quarters of growth greater than 3.2 percent over the president’s term. In 2016, this model predicts that without economic growth of 4 percent or more, the Democrats will get only 45 percent of the vote. Other models predict a Trump win—Alan Abramowitz’s “Time for Change” model in April, Helmut Norpoth’s “Primary Model” in May—while others, such as Moody’s Analytics, predict a Clinton win. However, given the slow present growth rates, most models show a very close election.
Our own assumption is that 2016 will be similar to 2012 in regard to the economy’s effect on the election. That is, it will not be determinative. This raises two questions: How did Obama win in 2012? And how much of his formula applies to the 2016 race?
Barack Obama won because in 2012 Democrats had a 5 to 6 percent advantage in party identification over Republicans. Mitt Romney did top Obama among true independents, but not by a large enough margin to give him a majority.
In short, for Republicans to win—then and now—they have to hold their own voters and then get more Democratic voters than they give up, or win a large share of independents.
The June 2016 YouGov panel of voters shows Democrats leading Republicans by 8 percentage points, 33 to 25 percent, which is consistent with other poll results. How do Clinton and Trump do with their own parties and independents? Consider this table from a few months ago:
Clinton Vs. Trump as of April 30, 2016
|
|
Democrats (%) |
Republicans (%) |
Independents (%) |
|
Clinton |
82 |
6 |
26 |
|
Trump |
6 |
74 |
37 |
|
Other/ Not Vote |
12 |
20 |
38 |
|
Total N |
738 |
560 |
866 |
Clinton does better, retaining 82 percent of her party’s voters, while Trump has 73 percent of his. Both Clinton and Trump get 8 percent of the opposite party’s vote, much like Obama versus Romney in 2012. As of June, Clinton was getting a higher percentage of a larger number, while Trump was claiming a lower percentage of a smaller number. Trump, therefore, needs to do exceedingly well with independents to win in November.
Roughly speaking, given the partisan support differences, Trump would need to collect 60 percent or more of the independent vote to win and, as the table shows, he is not that strong. Among the independents Trump would beat Clinton 31 percent to 27 percent, which would be insufficient to win the election.
A high number of independents and other voters, 38 percent, say that given these choices, they would not vote at all. In an echo of previous elections, at this point Clinton is doing better with Democrats than Trump is with Republicans, and Democrats are more numerous.
Trump says he will win a lot of Bernie Sanders’s supporters along with Clinton supporters. Is that likely? In our June survey we found that Clinton had not yet made much headway with Sanders supporters (see figure). We will track these Sanders supporters over the coming months to see which way they are going. If history is any indicator, we think Trump will not attract many from the Sanders camp.
Percentage of Sanders Voters Intending to Vote for Clinton in General Election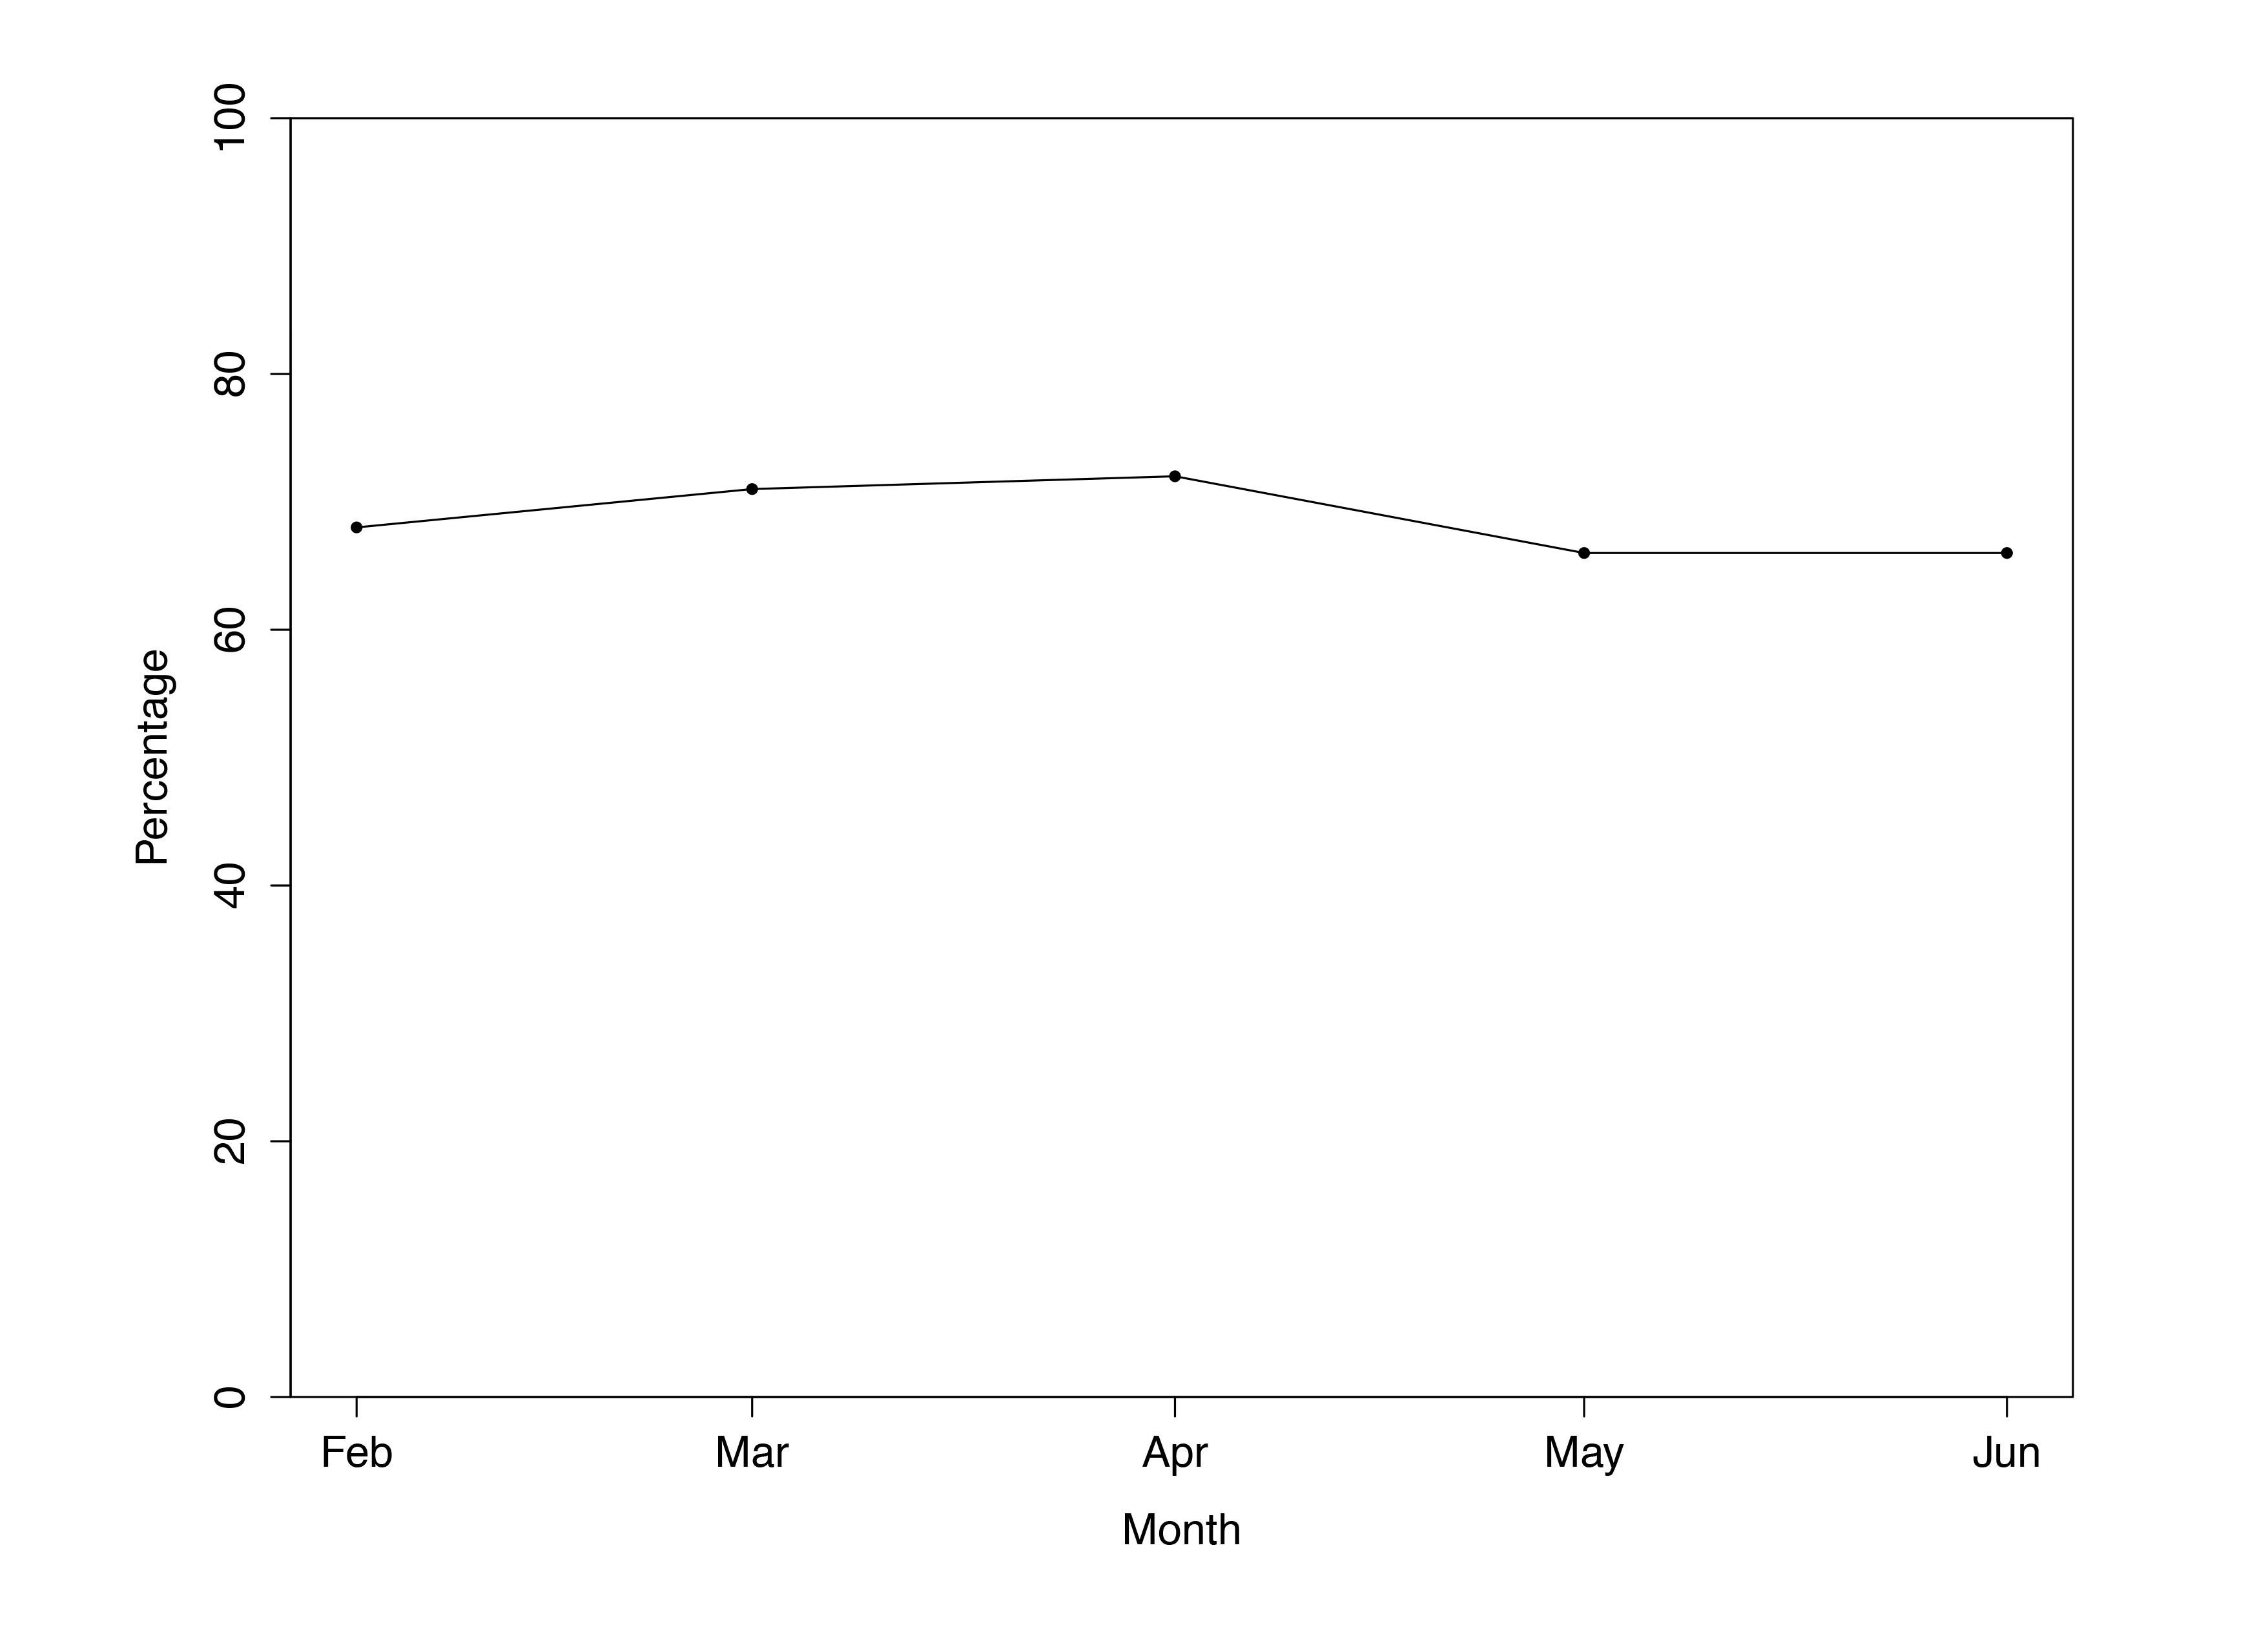
In the heat of a campaign, primary season partisans often express disillusionment with their candidate’s nemesis. In spring 2008, a high percentage of Clinton supporters said in exit polls that they would not support Obama. The autumn general elections results proved that they didn’t know their own minds: most of those Democratic Party loyalists had returned to the fold by November.
Another factor to consider in 2016 is whether Republicans who supported Ted Cruz, Marco Rubio, or John Kasich will follow suit and back the GOP nominee in the general election. Polling Cruz and Kasich supporters in June showed that about 5 percent of Cruz supporters, 22 percent of Kasich supporters, and 9 percent of other-candidate supporters would vote for Clinton. And 34 percent, 29 percent, and 27 percent, respectively, said they would vote for other candidates or not vote at all.
In short, Trump has picked up more Democratic votes than Clinton has Republican votes, but almost twice as many Republicans say they won’t vote for either Trump or Clinton than is the case for Democrats.
Democratic Party identification has increased relative to Republicans, with Democrats now holding an 8 percentage point lead. Moreover, since the beginning of the year, the Democratic Party has increased its approval rating, which is now within 5 points of its disapproval—43 percent approval to 48 percent disapproval—while Republicans have sunk to 66 percent disapproval and 21 percent favorable.
Democrats have suffered less from the nomination season than have Republicans.
There are four months left to campaign, and Clinton does have high negative ratings. Anything is possible. Polls change over time, as the following figure shows. However, with key groups, Trump remains more unpopular among Democrats than Clinton is among the corresponding Republican groups.
Democratic women vote Clinton over Trump, 84 percent to 3 percent, while Republican women vote Trump over Clinton at 74 percent to 7 percent.
Nonwhite Democrats choose Clinton over Trump at 88 percent to 2 percent, while some 77 percent of nonwhite Republicans like Trump versus 11 percent for Clinton.
Gallup Trial Heats
|
January 1972: Muskie-Nixon |
Even |
|
July 1976: Carter > Ford |
+33 |
|
March 1980: Carter > Reagan |
+25 |
|
May 1984: Reagan > Mondale |
+4 |
|
August 1988: Dukakis > Bush |
+17 |
|
April 1992: Bush > Clinton |
+19 |
|
February 1996: Clinton > Dole |
+4 |
|
June 2000: Bush > Gore |
+12 |
|
June 2004: Kerry > Bush |
+6 |
|
May 2008: McCain > Obama |
+6 |
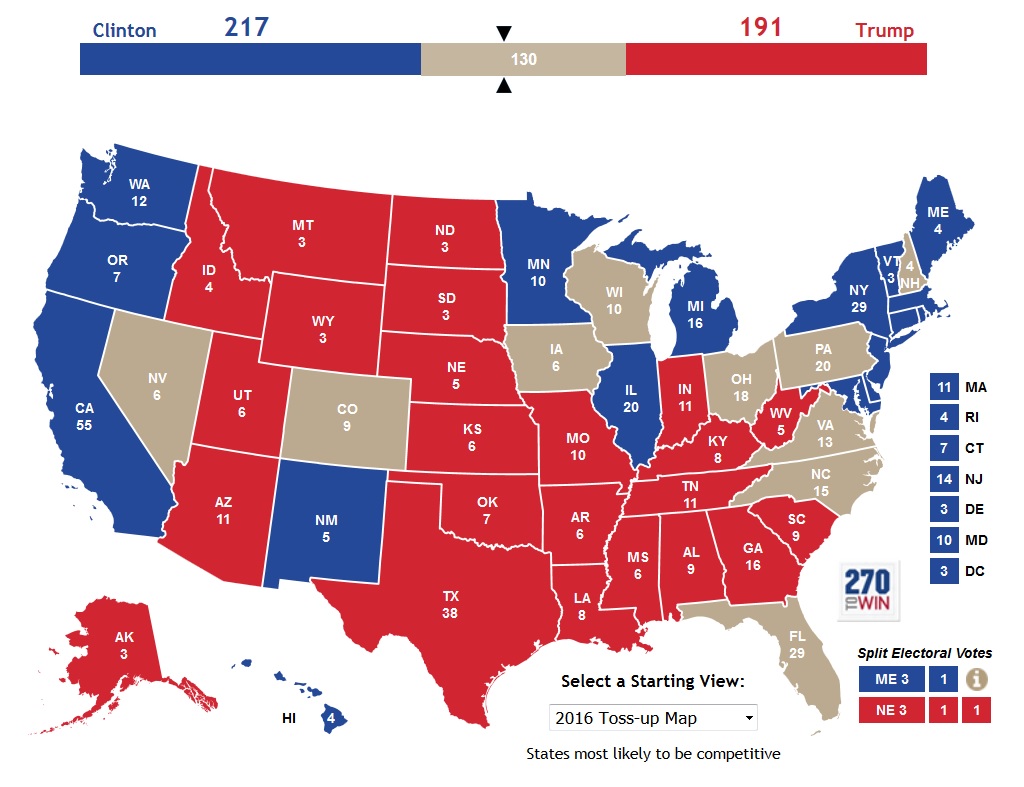
Over the next several months we will begin to do surveys and report results in the states that we think will determine the Electoral College winner. The following map shows the red and blue states plus the states that currently are up for grabs. Our reporting on the up-for-grabs states will begin after the party conventions.
2016 Presidential Election Map