


The author is a visiting scholar at the Hoover Institution and senior economist at Berenberg Capital Markets.
China has evolved from an engine of global growth to a source of weakness and risk, and it has its leaders and their economic policies to blame. Sizable government-generated excesses in real estate and debt are unraveling, weighing heavily on economic performance and government finances. Declines in household net worth are undercutting confidence and consumer spending. Many of the largest land developers have gone into bankruptcy or defaulted on their debt. Global economies and trade are also adversely affected. The US and Japanese experiences with real estate bubbles suggest that China probably will need years to unwind its excesses and revive dampened economic activity, and a fundamental assessment points to dramatically slower potential growth.
China’s path from impoverished nation to the world’s second-biggest economy and leading exporter was built on an odd combination. China’s leaders allowed US-style free enterprise to thrive alongside their central command-and-control regime, which dictated the allocation of resources. The capitalist elements took advantage of China’s abundant low-cost labor, ramped up capital investment, and drove innovation and entrepreneurship that generated sizable gains in productivity. Foreign physical and financial capital flowed into China, which acquired international technological know-how through both legal and illegal avenues. The economic results were remarkable: during the period 2000–14, China accounted for 30 percent of global growth and its share of global exports rose from 4 percent to 14 percent. Profits from its world-leading export-related manufacturing generated substantial wealth that was used to build productivity-enhancing infrastructure and a modern society.
Chinese leader Xi Jinping began clamping down on free enterprise in 2012 in favor of China’s socialist ideals and enhanced central control. He mistakenly believed that adhering to a socialist regime would maintain strong economic growth. China’s potential growth began to decelerate naturally as its labor and capital usage rose toward capacity, and productivity gains slowed, raising costs of production. The intense crackdown on the high-productivity high-tech and social media firms has been particularly damaging.
XI continued China’s long-standing central-planning practice of establishing annual GDP growth targets, and as potential growth decelerated, those targets became unrealistically high. While growth in consumer spending, private business investment, and exports simmered down, the high GDP targets were achieved through more and more government investment focused on infrastructure and real estate that relied heavily on debt financing.
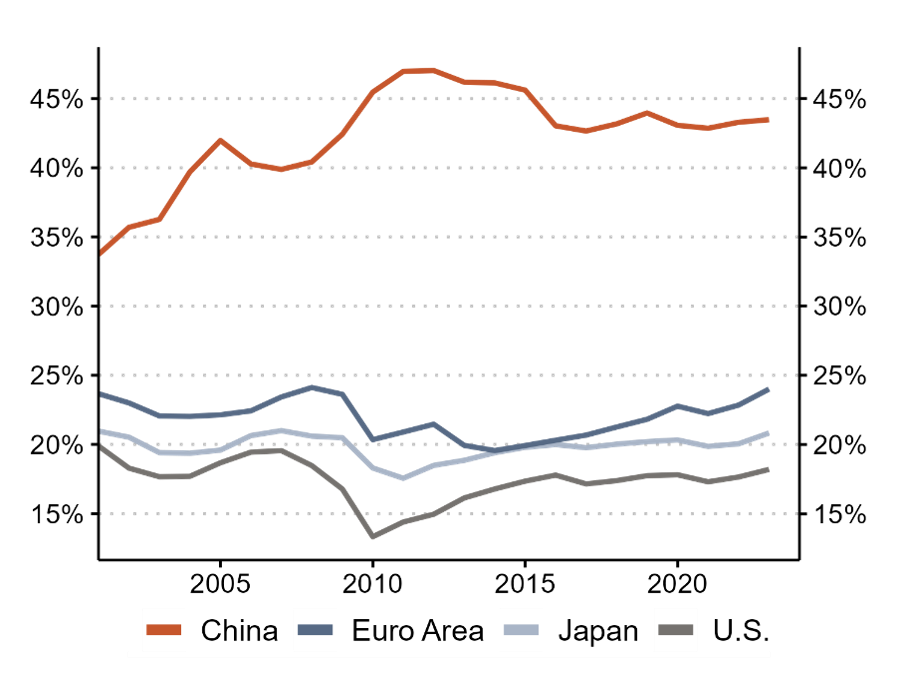
Chart 1. Gross capital formation as a percentage of GDP
Two tell-tale signs suggested that the run of strong GDP growth was unsustainable. First, gross capital formation (private plus government investment) remained above 40 percent of GDP, far above that of other nations, with a high and rising share investment in residential properties (chart 1). This resource misallocation pointed to lower productivity and future problems. Second, financing the government investment relied heavily on debt, and the murky web of flows that serviced the debt spelled trouble.
Analyzing the problem
Unlike in the United States, Chinese fiscal policy is financed partially by the central government and heavily by local governments, and administered largely by local governments, as dictated by Beijing leaders. Local government leaders met their GDP targets largely through investment spending on infrastructure and residential real estate activities. They relied heavily on land sales to real estate developers and borrowing through massive bond issuances. Local government financing vehicles (LGFVs) and shadow banks were heavy purchasers of the local government bonds. The LGFVs also invested directly in infrastructure projects, financed by leverage, and purchased land (on orders from Beijing when real estate softened). The LGFVs and shadow banks relied on fragile funding sources, including wealth managers that sought higher returns than provided by yields on deposits in the large state-owned enterprise (SOE) banks. Individual purchasers of bonds and investors in wealth management funds bore the risks, with large and often unspecified exposures to real estate. Private land developers also relied heavily on leverage and bond issuance. Before defaulting in 2021, Evergrande, a top Chinese developer that subsequently filed for bankruptcy, had an estimated $340 billion of debt.
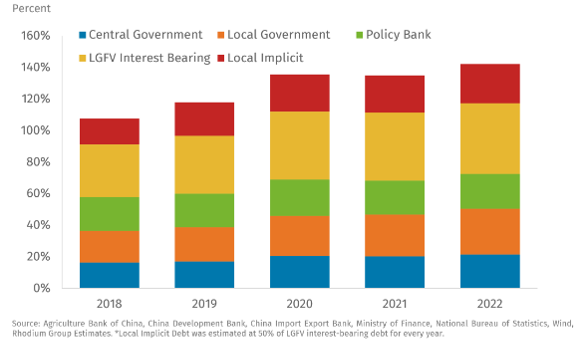
Official government statistics place the central government’s debt-to-GDP ratio at 22 percent through 2022, significantly below the United States’ 123 percent or Europe’s 89 percent. However, LGFVs are treated as private entitles and their debt is counted as corporate debt, which has ballooned. Total Chinese government debt, including central government, local government, LGFV, policy bank, and implicit (schools, hospitals, etc.), is conservatively estimated at 142 percent of GDP (chart 2). This ratio is above those of the United States and Europe but well below Japan’s 264 percent. As in Japan, the largest portion of Chinese government debt is held by domestic creditors, particularly as foreign holders have reduced their exposure in response to mounting credit problems of China’s real estate developers.
Chart 2. China’s explicit and implicit government debt as percent of GDP
China’s fiscal policy and debt financing hinged critically on rising real estate values and expectations. The mounting excesses in real estate began unraveling in late 2021 as expectations shifted down and housing demand fell. Land sales and construction collapsed. This undercut local government finances. More than fifty developers have filed for bankruptcy or defaulted. Some cash-strapped local governments are having trouble servicing their debt and have requested financial support from Beijing.
Consequences
The Chinese economy must now adjust to the unwinding of the government-generated excesses in real estate and debt. Signs of weakness are spreading. Real estate activity and prices are falling. A reported sixty-four of sixty-nine cities report declining prices of existing residences, and mounting anecdotal evidence and debt defaults by leading land developers suggest declines are steeper than data provided by China’s National Bureau of Statistics (NBS). Expectations that prices will fall further are deterring home purchasers.
Consumer spending is weak, reflecting job losses and lower wages in manufacturing, while household net worth that had become overweighted on real estate has fallen sharply. Consumer confidence has fallen sharply and will undercut government efforts to stimulate spending. The NBS has decided to stop publishing the unfavorable confidence survey data.
Gross capital formation is now a key source of weakness in the domestic economy. Private business investment is soft, and the financial challenges facing local governments and LGFVs are severely constraining government investment spending.
China’s exports and imports are both falling. Exports fell in July 2023 by 14.6 percent year over year in US dollar terms (9.3 percent in yuan terms). Weak global demand for Chinese goods reflects slow growth globally, with softer US goods consumption; overall weak conditions in Europe; and efforts by advanced economies to reduce reliance on Chinese goods and supply chains. China’s exports to advanced nations fell by larger percentages, but its exports to Russia have soared over 70 percent in the past year from a relatively small base.
The sharp decline in Chinese imports in July—down 12.2 percent year over year in USD terms and 6.7 percent in yuan terms—is associated with weak domestic demand. Falling imports of consumer goods reflects soft consumption, while the slump in production in China’s export-related manufacturing sectors lowers the demand for imported capital goods.
The unreliability of China’s official data increases the difficulty of assessing true economic conditions. Not surprisingly, the NBS has stopped publishing select data that are particularly downcast; besides consumer confidence (no longer released after April 2023), the youth unemployment rate, over 21 percent in its last reading, is no longer published. Forecasting China’s GDP growth is perhaps more a game of estimating what China’s leaders and the bureau of statistics choose to publish than a forecast of realistic trends. Anecdotal evidence is dominated by signs of empty apartment complexes rather than construction cranes; weaker consumer spending is confirmed by declining imports from Japan and South Korea; and the highly publicized failures and bankruptcies of China’s major building developers continue to jar bond markets. A critical issue influencing GDP forecasting is whether China has the financing bandwidth to maintain rapid spending of government.
Global jitters
China’s economic weakness is spreading internationally, contributing to declining global trade volumes that have fallen below pre-pandemic levels (chart 3, data through June 2023). Nations and companies with large export exposure to China have been the hardest hit. Asia, the world’s biggest trading bloc, is feeling the biggest impact. Exports of every major Asian nation (China, Japan, South Korea, Taiwan, Hong Kong, Singapore, India) and Australia are falling, although levels remain above their pre-pandemic trend lines. Many emerging economies that rely heavily on exporting commodities and industrial materials to China are also experiencing declining exports and falling prices.
Chart 3. World trade volume (seasonally adjusted, 2010=100)
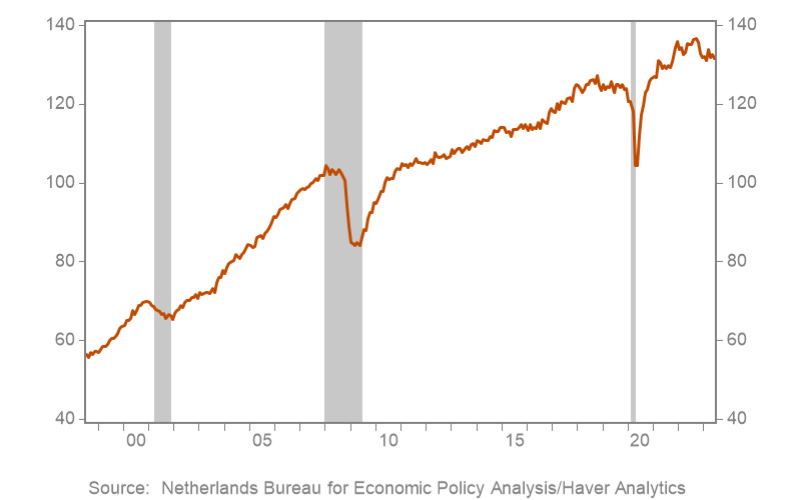
Chart 4. US and euro area exports as a percent of GDP
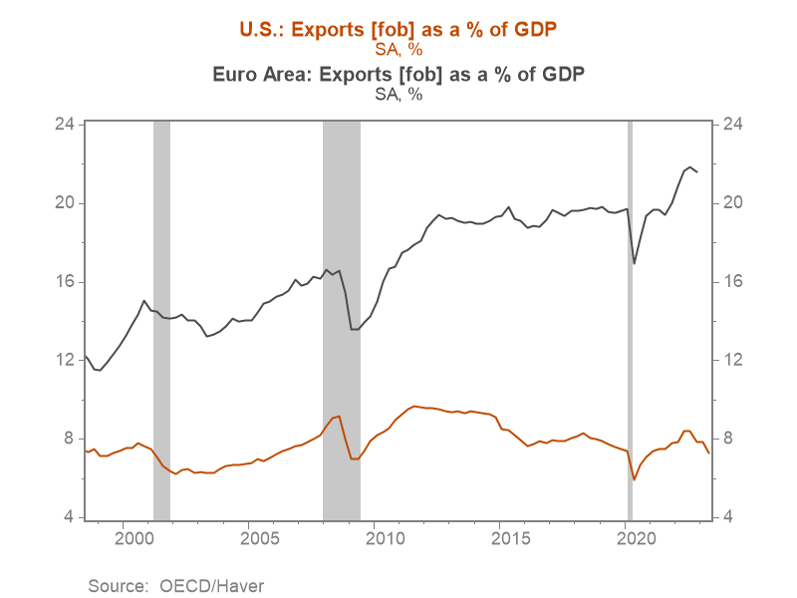
European economies have significant exposure to China, both directly and indirectly, and are experiencing declining manufacturing production. Germany has significant export exposure to China, particularly motor vehicles and parts. China is excelling in the production of electronic vehicles (EVs) and has surpassed Japan and Germany as the world’s largest auto exporter.
The United States is better situated, with relatively less export exposure to China. Its export of merchandising goods as a percentage of GDP is nearly one-third less than Europe’s share, according to OECD data (chart 4). Moreover, the United States’ largest trading partners—Canada and Mexico—are better positioned than most nations and may benefit from an increase in production facilities as global companies reduce their supply chain exposures to China.
Hard lessons in Japan and the United States
The history of excesses in real estate, debt, and asset price bubbles—Japan in the late 1980s and the United States in the early 2000s—suggests China’s unwinding will be long, and likely an economic drag for years.
The US debt-financed housing bubble of the early 2000s offers a useful comparison. Fannie Mae and Freddie Mac, the two government-sponsored enterprises that finance and support mortgage lending, infused excessive risk-taking and leverage into the mortgage market, creating systemic risk. The Federal Reserve kept interest rates low. These factors led to excessive reliance on debt and boosted home values. When expectations of home values shifted down, complex derivatives of the mortgage debt unraveled and devastated the mortgage market.
The origin of Japan’s excesses had different parallels to China. Japan’s economy boomed from the conclusion of World War II through the mid-1980s, and then slowed as its approached capacity. Japanese leaders failed to acknowledge that its potential growth had slowed, and the Bank of Japan kept rates artificially low to pump up growth. The low rates did not generate faster growth or consumer price inflation but instead generated a severe asset price bubble, with the Nikkei and property prices rising to dizzying heights. At the peak, Japan’s debt levels were moderate, far below China’s current ratios as a percent of GDP. The Bank of Japan raised rates to let some air out of the bubble, which led to a collapse of 75 percent in the Nikkei and a 70 percent decline in land values.
Both episodes, the unwinding of the US debt-financed housing bubble and Japan’s asset price bubble, were long and dampened economic performance. The unraveling of the US mortgage and short-term funding markets provoked a financial crisis. Household balance sheets were crippled. Insolvent big banks that were overinvested in risky mortgage-backed assets required capital infusions from the government. Bank loans declined through 2013 and the recovery from the “global financial crisis” was soft. Japan’s government did not acknowledge that the collapse in asset prices had generated insolvent conditions in banks, which were allowed to continue operating. Bank lending fell and Japan incurred a “lost decade” of on-and-off recession and mild deflation. The Japanese government finally recapitalized and reorganized the banking system in 1997, financed by rising government debt.
China has already acknowledged its real estate woes and is providing capital and regulatory support, but the harm to consumer balance sheets and government finances poses major challenges. In particular, the blow to government finances will severely crimp fiscal stimulus and the ability of government investment spending to prop up GDP growth. One way or another, unwinding China’s real estate and debt excesses will be costly, and it will take years rather than months. Chinese leaders will likely manage to avoid a financial crisis or an extended Japan-style bout of recession and mild deflation, but they will be unable to avoid the drag on growth.
The outlook for growth
Beyond the necessary unwinding of excesses, China faces diminished longer-run potential growth. Its biggest problem is its leaders’ rejection of US-style free enterprise and capitalism, the primary driver of its sustained robust growth that made it an economic powerhouse in the first place. Realistically, China’s leadership will continue to be guided by communist ideals while clamping down on entrepreneurship and capitalistic behavior deemed inconsistent with those ideals. In this context, consider the basic foundations of potential economic growth: growth in labor force and capital, and productivity.
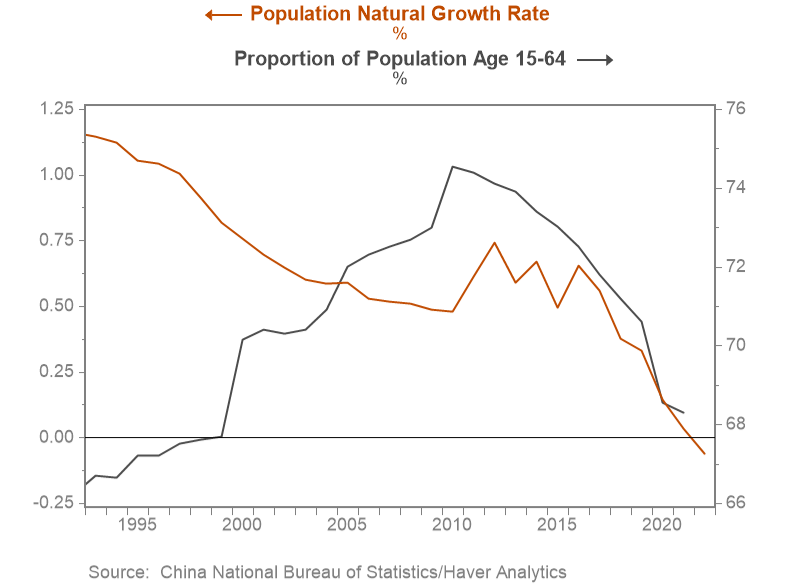
China’s population and labor force are declining (chart 5). The realities of its one-child policy have caught up with demographics and will persist. That leaves capital and productivity to pick up the slack. Gross capital formation will continue to grow rapidly, but a high and rising share will be government investment spending, including government allocations to low-productivity state-owned enterprises. Weakened local-government finances will limit investment spending and fiscal stimulus. Business investment in capital will be constrained by government mandates and regulations and by slower growth of the economy, profits, and cash flows.
Chart 5. Chinese demographic trends
The prospects for sustained rapid productivity gains are diminished by the high and rising government share of gross capital formation and outsized allocations to the large, low-productivity SOEs, while the government continues to suppress China’s highly productive private sector.
Meanwhile, the large and highly productive export-related manufacturing sectors have begun to feel the impact of efforts by Western nations to reduce their reliance on Chinese supply chains. This trend is gathering momentum, with measurable impacts on China’s exports. The Biden administration has placed limits on US exports of advanced semiconductors and quantum-computing capabilities to China and investments in China that are deemed important to US national security. Other Western nations are following suit. China needs such key inputs for its advanced semiconductor and AI development, and for its ability to acquire critical technological know-how. This will constrain productive capacity.
The last official government target for real GDP was 5 percent, but Chinese leaders have backed away from that. They understand that the economy is sputtering and that fiscal stimulus is limited by the government’s stretched finances. A reasonable intermediate-term estimate of China’s potential growth is approximately 2 to 3 percent. Straining for a higher target would require excessive reliance on government investment in unproductive activities that would further lower potential growth. Setting a much lower growth target would be economically rational but the government is highly unlikely to take such a sharp departure.
Obviously, this puts Chinese leaders in a bind. They are struggling with the tradeoff between adhering to socialist ideals and maintaining central control over their citizens, and weaker economic performance and the unwelcome social effects that may follow.
While China is no longer the engine of global growth, it remains a powerhouse as the world’s second-largest economy and is highly innovative in an array of high-tech sectors. Its market for many consumer goods is the biggest in the world. The surge in China’s production and export of EVs highlights its economic prowess. Even if its domestic demand growth remains weak and foreign demand for Chinese goods gradually slows, China will remain the largest and most important manufacturing and global trading hub for years to come.
But China’s biggest trading partners and the world’s economies must adjust to—and brace themselves for—permanently slower growth and continuing challenges. Beyond the implications for economic conditions, this new climate will have profound implications for China’s geopolitical posture and strategies.