


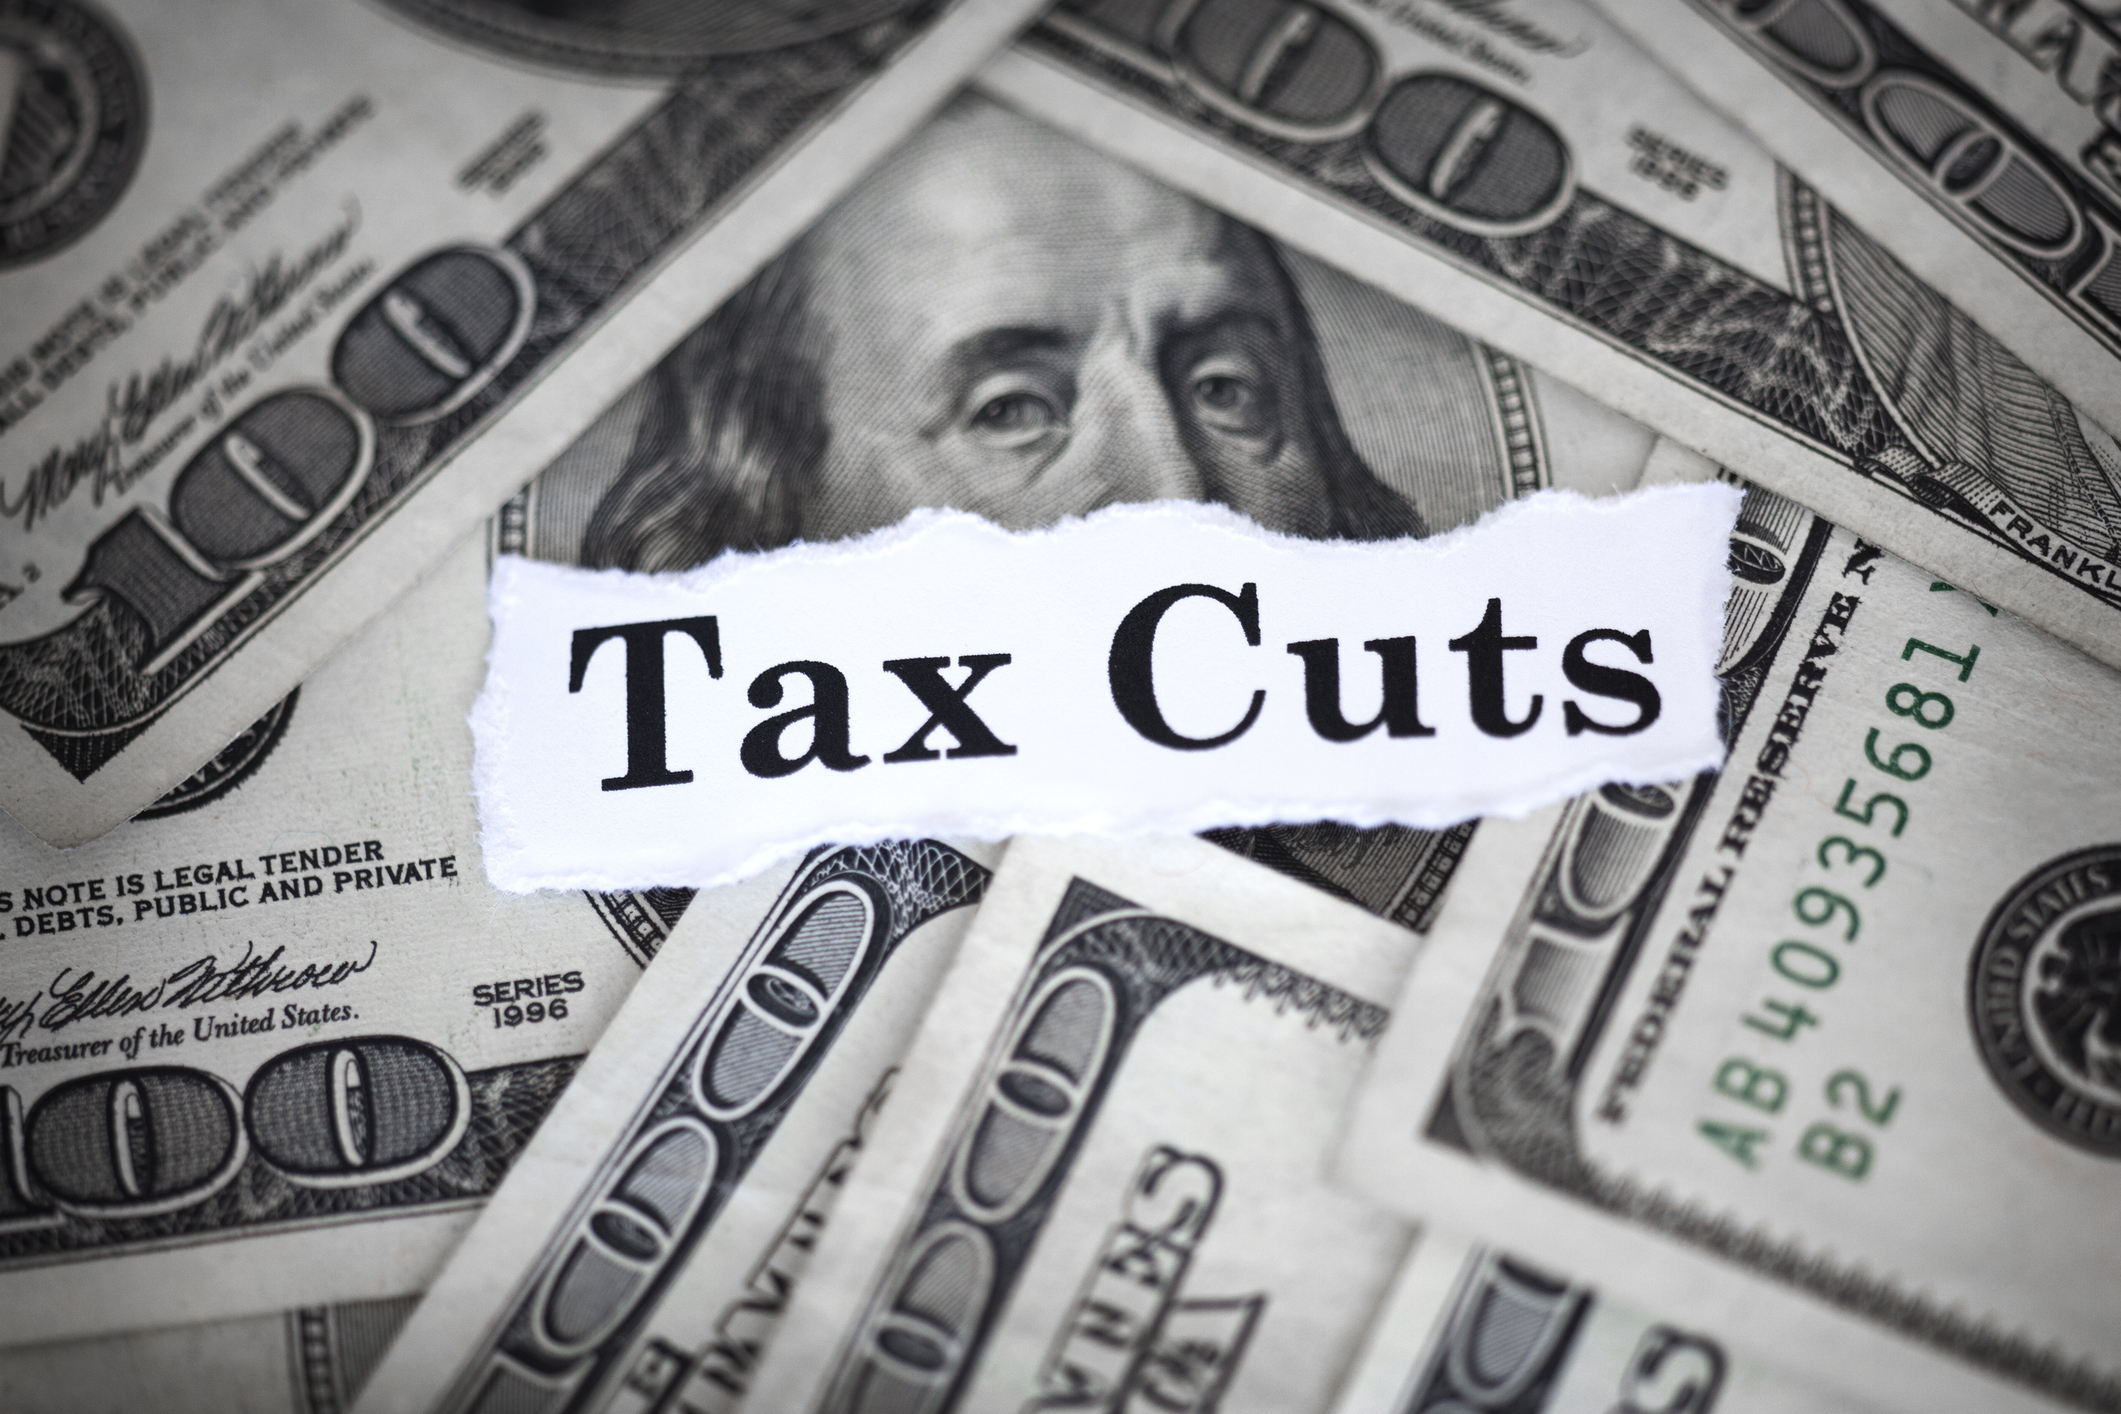
The Hoover Institution polled 1,775 members of the American public using YouGov on April 4–10, 2025, about their attitudes toward the extension of the Tax Cuts and Jobs Act (“Trump Tax Cuts”) currently being negotiated in Congress.
The survey revealed that while Americans are worried about future federal debt and deficits, they have large gaps in knowledge about what the federal government spends money on and what is included in the 2017 Tax Cuts and Jobs Act extension that is being negotiated by Congress at this time.
Click here to see the full topline results.
Click here to see the full crosstabs.
Learn more at the Hoover Institution’s Fiscal Policy Initiative.
Key Takeaways
Of those polled, 75% are concerned about the growing federal debt and believe Congress should prioritize deficit reduction, yet only 17% correctly identify Social Security as the largest federal spending program.
Knowledge about the Tax Cuts and Jobs Act is remarkably low, with only 11% of respondents answering at least 7 of 10 questions correctly, and 54% getting only 3 or fewer questions right.
Political divisions emerge in views on extending the TCJA, with 67% of Trump voters supporting full extension compared to 41% of Harris voters, and stark partisan differences on whether extensions should be targeted to middle and lower-income Americans.
Respondents systematically underestimate the tax burden on high-income earners, with 73% proposing maximum tax rates that are actually lower than what high earners currently pay, while simultaneously overestimating top earners' share of total income.
Americans are worried about the federal debt.
- 75% believe the federal debt is growing at an unsustainable pace.
- 75% believe Congress should make reducing the federal deficit a priority.
- 71% believe US federal debt will be larger in 10 years.
But Americans are not well informed about what the federal government spends money on.
- Only 17% know that Social Security is the largest federal spending program.
- The young (24%) were twice as likely as the elderly (12%) to know Social Security is the largest federal spending program.
- 38% believe defense or foreign aid is the largest spending category.
- 42% of Harris voters believe defense is the largest spending category (18% correctly identified Social Security).
- 17% of Trump voters believe foreign aid is the largest spending category (18% also correctly identified Social Security).
Americans underestimate how much high-income earners pay in taxes and overestimate how much they earn.
- 66% support having high-income earners pay a larger share of federal income taxes than they currently pay.
- 60% believe families earning over $1 million per year should pay higher federal income taxes than they currently do.
- But when asked about what the highest tax rate should be, 73% of respondents offered a maximum top rate less than what high-income filers pay today.
- Earners in the top tax bracket currently pay an average of 27.3 percent of their adjusted gross income on income taxes.
- 73% of respondents said the most any taxpayer should pay is 27 percent or less of their income.
- Americans overestimated the share of all income earned by those in the top bracket.
- Median response: 24% vs. actual answer: 17%
- Americans underestimated the share of all income taxes paid by those in the top bracket.
- Median response: 15% vs. actual answer: 33%
Americans know very little about what was in the 2017 Tax Cuts and Jobs Act (TCJA).
We asked respondents 10 factual questions about the Tax Cuts and Jobs Act. (If respondents answered “Not sure,” we marked them as not knowing the correct answer.)
- Only 11% were able to get at least 7 of 10 questions right.
- 35% got between 4 to 6 questions right.
- 54% knew the answers to only 3 or fewer questions.
We asked a total of 26 factual questions about the TCJA and the tax code.
For questions with an answer as a percentage (e.g.,“To the best of your knowledge, what is the top marginal federal income tax rate?”), we scored answers within ±10 percentage points as correct.
- 74% got fewer than half of the 26 questions correct.
- 49% got 9 or fewer correct.
Support for extending the TCJA depends on what parts up are up for extension.
- A plurality (49%) favors extending all tax provisions of the TCJA set to expire at the end of 2025, while 20% oppose and 30% are unsure. Support varies between Trump voters (67%) and Harris voters (41%).
Voters favor having Congress extend the TCJA . . .
- . . . even if it increases federal deficits and debt over the next 10 years?
- 55% Trump voters vs. 36% Harris voters
- . . . even if it means allowing tax rates to rise for some individuals?
- 49% Trump voters vs. 45% Harris voters
- . . . as long as the tax reductions are offset by spending cuts elsewhere in the budget?
- 70% Trump voters vs. 32% Harris voters
- . . . only for middle- and lower-income Americans, with tax rates allowed to rise for higher earners?
- 55% Trump voters vs. 80% Harris voters
- . . . offsetting the cost of extending the tax cuts with lower Medicaid spending?
- 40% Trump voters vs. 14% Harris voters
Support for some tax deductions remains quite high.
- 41% favor maintaining the $2,000 child tax credit, 24% support increasing it further, and only 16% want to restore the pre-TCJA $1,000 level.
- 47% support maintaining the higher standard deduction introduced by the TCJA, while 23% would prefer to restore the previous lower standard deduction with personal exemptions.
- 35% support maintaining the lowered limits on deductions for state and local taxes and mortgage interest, 22% want to restore previous higher limits, and 36% are unsure.
What will happen to deficits if the TCJA tax cuts are extended for another 10 years?
- Only 27% of respondents said deficits would go up.
- 24% of Trump voters vs. 31% of Harris voters predicted they would go up.
What makes a family middle class or rich?
- To be middle class, the median respondent said, families had to have an annual income of $85,000. Answers in the middle 50th percentile (25th to 75th) ranged from $50,000 to $120,000.
- Trump voters had lower answers: median response $80,000, with the middle 50th percentile range of $60,000 to $100,000.
- Harris voters had higher answers: median response $100,000, with the middle 50th percentile range of $70,000 to $150,000.
- To be considered rich, the median respondent said, families had to have $500,000 in annual income.
- Middle 50th percentile answers were the same across Trump and Harris voters, from $200,000 to $1 million in income.
- Median responses were slightly different among Trump versus Harris voters: $400,000 to $500,000, respectively.
Should . . .
- . . . high-income earners pay a higher share of federal income taxes than they currently do?
- All respondents: 66% favor a higher share.
- Trump voters: 55% favor a higher share.
- Harris voters: 87% favor a higher share.
- . . . families earning over $1 million annually pay higher federal income taxes than they currently do?
- all respondents: 60% say higher
- Trump voters: 46% say higher
- Harris voters: 83% say higher
- . . . families earning over $400,000 annually pay higher federal income taxes than they currently do?
- all respondents: 41% say higher
- Trump voters: 31% say higher
- Harris voters: 59% say higher
- . . . families earning over $100,000 pay higher federal income taxes than they currently do?
- American public: 13% say higher
- Trump voters: 10% say higher
- Harris voters: 15% say higher
What is the maximum amount a middle-class or rich family should have to pay in taxes to the federal government as a percentage of their income (income and payroll taxes)?
- 25th percentile, median, and 75th percentile answers:
- All respondents: 5%, 10%, 15%
- Trump voters: 5%, 10%, 15%
- Harris voters: 7%, 15%, 20%
What is the most any taxpayer should pay of their income in taxes to the federal government?
- 25th percentile, median, and 75th percentile answers:
- All respondents: 5%, 12%, 25%
- Trump voters: 5%, 12%, 20%
- Harris voters: 10%, 20%, 35%
What is the highest federal income tax rate that anyone should have to pay? In other words, when someone makes an additional dollar, what is the highest percentage of that dollar that they should pay in taxes?
- 25th percentile, median, and 75th percentile answers:
- All respondents: 5%, 15%, 30%
- Trump voters: 5%, 12%, 25%
- Harris voters: 3%, 10%, 40%
What percentage of US households should not have to pay any taxes at all?
- 25th percentile, median, and 75th percentile answers:
- All respondents: 2%, 10%, 40%
- Trump voters: 0%, 10%, 40%
- Harris voters: 8%, 20%, 30%
Do you approve or disapprove of the way Donald Trump is . . .
- . . . handling his job as president?
- All respondents: 42% approval to 49% disapproval
- Trump voters: 86% to 11%
- Harris voters: 6% to 91%
- . . . handling the economy?
- All respondents: 40% approval to 51% disapproval
- Trump voters: 82% to 13%
- Harris voters: 5% to 91%
- . . . handling immigration?
- All respondents: 47% approval to 45% disapproval
- Trump voters: 88% to 10%
- Harris voters: 11% to 86%
- . . . handling foreign policy?
- All respondents: 41% approval to 49% disapproval
- Trump voters: 81% to 12%
- Harris voters: 6% to 90%