


PARTICIPANTS
David Neumark, John Taylor, David Brady, John Cochrane, Chris Dauer, Steve Davis, Sami Diaf, Nick Gebbia, Bob Hall, Nick Hope, Ken Judd, Jyotsana Kala, Evan Koenig, Jeff Lacker, David Laidler, Ross Levine, Jacob Light, John Lipsky, Justin Matejka, Brendan Moore, Elena Pastorino, Paul Peterson, Milan Quentel, Valerie Ramey, Stephen Redding, Abraham Sofaer, Jack Tatom, Yevgeniy Teryoshin, Marc Weidenmier, Alex Zentefis
ISSUES DISCUSSED
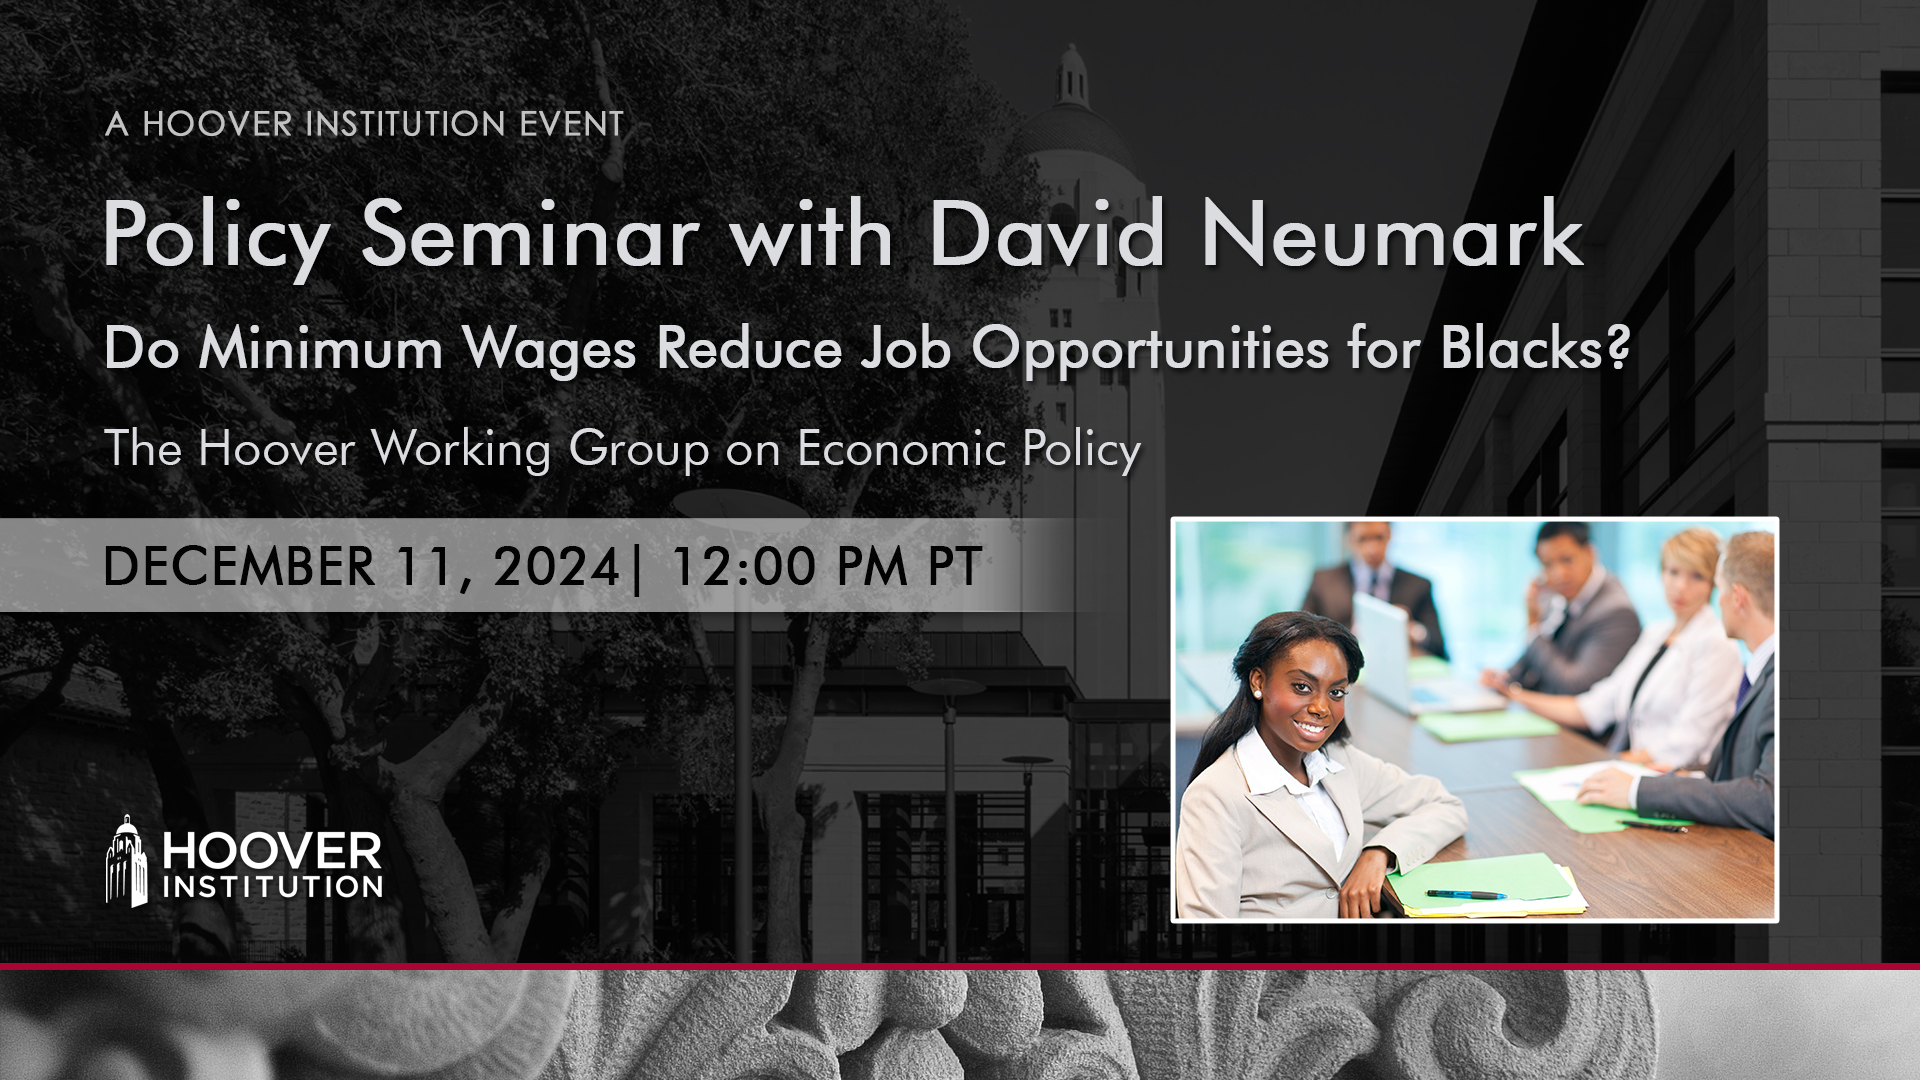
David Neumark, Hoover visiting fellow and distinguished professor of economics and codirector of the Center for Population, Inequality, and Policy at the University of California–Irvine discussed “Do Minimum Wages Reduce Job Opportunities for Blacks?” a paper with Jyotsana Kala (UC Irvine).
John Taylor, the Mary and Robert Raymond Professor of Economics at Stanford University and the George P. Shultz Senior Fellow in Economics at the Hoover Institution, was the moderator.
PAPER SUMMARY
We provide a comprehensive analysis of the effects of minimum wages on blacks, and on the relative impacts on blacks vs. whites. We study not only teenagers – the focus of much of the minimum wage-employment literature – but also other low-skill groups. We focus primarily on employment, which has been the prime concern with the minimum wage research literature. We find evidence that job loss effects from higher minimum wages are much more evident for blacks, and in contrast not very detectable for whites, and are often large enough to generate adverse effects on earnings. We supplement this work with additional analysis that distinguishes between effects of an individual’s race and the race composition of where they live. The extensive residential segregation by race in the United States raises the question of whether the more adverse effects of minimum wages on blacks are attributable to more adverse effects on black individuals, or more adverse effects on neighborhoods with large black populations. We find relatively little evidence of heterogeneity in effects across areas defined by the share black among residents.
To read the paper, click here.
To read the slides, click here.
WATCH THE SEMINAR
Topic: “Do Minimum Wages Reduce Job Opportunities for Blacks?”
Start Time: December 11, 2024, 12:00 PM PT
>> John Taylor: Have honor to have David Neumark speak to us today. And your co author is up there on the screen there.
>> David Neumark: She's up there.
>> John Taylor: Hi, welcome.
>> Jyotsana Kala: Thank you.
>> John Taylor: But the title is really intriguing. Do minimum wages reduce job opportunities for Blacks? Question. Go ahead, man.
>> David Neumark: All right, thank you. Thanks for coming. This is I think my third seminar in three years. I gave one that was kind of heavy duty econometrics. Is that too loud or that good one was all this machine learning stuff. This one's really simple. This is like running up the middle on third and one for those who know the football analogies.
But you can see what the title is. I've been to some seminars here where I feel like people are gratuitously name dropping the name Milton Friedman. But I think in this case it's really appropriate and you'll see what I mean in a minute. Anyway, so this is part of my ongoing addiction to minimum wage research.
And we take on this question of race differences and effects of minimum wages. It doesn't have to come out of this motivation, but this is kind of what got me thinking about this. There's been this growing research literature as well as advocacy and on this topic these things often go hand in hand.
Basically arguing that higher minimum wages close the race gap in earnings or in wages. Now obviously that's not that interesting a question. Conditional unemployment. Blacks earn less than whites and you raise the minimum wage and you only look at people who have jobs. The wage gap presumably is going to be narrower.
But nonetheless one of these papers is published in the qje. So make up that what you will starts from the premise. Not a lot of evidence, a little bit. There's nowhere negligible employment effects, which is how some people summarize literature. And then as I said then not surprisingly you get this narrowing of the race gap.
And this has started to this argument. Minimum wages has started to I think permeate policy debate. Just in terms of this paper and its conclusions, it's based on data from the 60s. The 60s is a nice period because there were these big expansions. So it was this big.
We had the minimum wage went up and the number of workers it covered went up a lot. So it's a nice period to study. On the other hand, it's also 60 years ago, so not as relevant to what goes on today. Even in another paper by Martha Bailey and co authors just kind of doing the same thing concurrently, they have the same result for wages, but they point out there is some job loss a little more severe for blacks than for whites.
That offsets this to some extent. I find their paper more convincing, although it's quite similar. Anyways, and I would argue, and I'll just say this, I don't want to go into the minimum wage debate, but I'll just show this one slide which you've already seen and don't try to read the stuff on the left hand side.
I'll just tell you what the picture says. This is just the premise that minimum wages don't reduce jobs just isn't supported by the research literature. This is just a survey we did of all the state level or less than state level panel data studies. Diff and diff, whatever.
Since the early 90s when people started doing this, we take the preferred estimates from the papers. We actually surveyed the authors and made sure we identified the same preferred estimates. These are the estimates, 0. You can see the zero line. These are elasticities. So the mean and median are about minus 0.1, minus 0.2, which is far for the course.
They're darker when they're more significant. The only way you can look at this literature and say minimum wages don't reduce employment or raise it is by ignoring most of the research. Now you might, because you might think it's wrong. And that's a topic I talked about previously, so I won't get into that.
But should I say I think the question of the minimum wage effects by race is interesting and surely shouldn't just look at this conditional unemployment. None. There's almost nothing. It is amazing. So I don't know how many studies are in this thing, but there's roughly 200 US studies, I think since the early 90s or so of minimum wages.
I think actually except for the two I talked about which are mainly focused on wages, none are explicitly motivated by the race question. There's only a couple more that have anything on this topic, which is kind of amazing. I think it wasn't the core reason we wrote the paper, but I thought it would be interesting whatever the answer was.
Oops, did I go the wrong way? No, sorry, I did go the wrong way. I just made one more point. And this question about when we take account of employment effects and not just wage effects, we could get a different answer or more striking answer if the effects are more diverse for blacks.
Was there a question? No, okay. Okay, so to land this question, there's very little on this washer and I have a little stuff on race, but it's Kind of buried in a sort of very different question about minimum wages and EITCs. The most direct paper is Don Deere and Murphy and Welch have an AEA papers and proceedings thing back in the early stages of this debate.
They're just sort of using Blacks versus Whites as kind of a third level of difference in the federal minimum wage goes up. We know it's hard to infer anything from a federal increase. They say, well blacks must have been more affected by whites and lo and behold their employment falls relative to that of whites.
So that's one episode and some evidence in this direction that's about it. At the same time there's a ton of work that says when you look at you do standard minimum wage employment kind of analysis as you zoom in on the less skilled. And it's usually because of the data defined in terms of age or education, sometimes in terms of industry, but that may not be skill rather than just wage, who knows.
But mainly age and education. The minimum wage effects are more adverse. So might we expect this for blacks as well? They have lower observable skills, I'll show you that. And potentially lower unobservable skills. And they may be undervalued because of discrimination which from the point of view of this analysis is essentially the same as having lower skill in at least a Becker employer type of model, employer discrimination kind of model.
So Friedman had this 1966 OPed in Newsweek. I am convinced that the minimum wage law is the most anti negro law on our statute books. I don't know why the most, but anyways that's not the point. But he was obviously talking about exactly this issue. You have a group that is lower wage and you now say you can't hire anyone below wage acts and it's higher than some people's wages, it's gonna affect them more adversely.
>> John Cochrane: I guess that a lot of 1950s labor legislation unions, I'm guessing them deliberately had that goal, keep blacks out of the union labor force.
>> David Neumark: Right. So I think in the union setting Ray Marshall was the one who sort of broke a lot of that evidence that that was part of it.
And I've seen this argument made about minimum wages. When I hinted at this in our classic liberalism seminar a month ago, I was, David Henderson or somebody else mentioned some labor history that claims that. I sort of went back and forth of whether to put this in or not.
You know, the problem is I can, I can find a historian that says this. But to really assess it is I was worried when you get out of, you know, get out of your out of your own area of expertise, and you can sort of find something to support what you say.
But there may be a lot more written. But, yeah, people have certainly argued this, that with the great migration to the north which was a lot of low I mean, a lot black labor, it was lower skilled, and obviously, they could push down wages. It would have been rational.
And some people talk about that. Bu I think it's fair to say that unless I'm really crazy, that's not the motivation now. Right. So I don't think anyone advocates. Advocating for higher minimum wages is coming from that perspective, even though as I'll show you kind of what's happening.
Okay, so the core goal of this paper is to estimate employment effects of minimum wages for blacks as compared to whites. As I said, it's a very simple paper. Let me summarize conclusion. Just so you know, some of you have to leave also. When you look at blacks, essentially what happens is I'm not surprised.
I mean, I guess I might have found no significant differences. That wouldn't have surprised me. I wouldn't have been surprised if I found some evidence of somewhat more adverse for blacks and more adverse effects for blacks than whites. The answer is you really can't find anything for whites, and all of the job loss is falling on blacks.
I'm gonna show you that we think of this basically, or it'll get fancier for whatever reason. But separate regressions for blacks and whites and whites, the estimates are near zero. They're probably generally negative, but very small and insignificant. The black estimates are quite large. The elasticities for blacks are sometimes as large as minus 0.3 or higher.
These are gonna be different low skilled groups defined on age, education or both. And it suggests that this is why I find this so surprising. This seems A important and B hard to believe we've missed. Now, maybe I'm wrong and other papers will. It's the first paper that's really looking at the systematically, so I don't wanna get on a soapbox until it's been vetted a bit more, but at least at this point it's pretty striking.
It's also true that the wage elasticities, they're harder to estimate in the data we use, but the wage elasticities are smaller than the employment elasticities which suggest that earnings of blacks actually fall, right? It's not just that there's some job loss, but earnings actually fall, and we actually confirm that directly.
And I should say, I don't say it here, but I say it at the end. All of this is a little worse for black males than for black females, although those results are probably not generally statistically significant. So I think it's surprising. I think the policy implications for thinking about race differences in employment are pretty dramatic and probably controversial, which is why I'm getting all the feedback I can.
Although we have put this out as a working paper after beating it up for nine months to see if we really believe the answer, and we do. We also have this other dimension of the paper which I was actually another part of the motivation originally, because I have an urban economic sort of hat I wear sometimes as well.
This turns out not to matter much, but there's still a real interesting angle to it. So, residential racial segregation is extensive in New York. I'll show you a figure later. For those who don't know the numbers, it's pretty striking. So one possibility is there are more adverse effects for blacks because of where they live.
It's more about where they live than who they are, the color of their skin. So we run a series of models that try to test that, essentially looking for interactions with the share black in the neighborhood, which for us is gonna be pumas. We look at that, and why might this.
Why might we find something, so racist race is very. There's a lot of segregation race as a result, there's a lot of segregation of poverty. More so for blacks than for whites, actually. Different businesses can have different margins, different sensitive to the minimum wage. You know, think about like the food deserts literature and these kind of things.
You can imagine there's fewer substitutes in poor neighborhoods. So Marshall's laws might imply product demand is less elastic. So maybe the minimum wage effects are weaker in those areas. We don't know. There could be more product market concentration. I always have trouble thinking through this, all this work on monopsony.
I'm still having trouble often figuring out whether people are talking about. Labor market concentration or product market concentration and the measures they use, another issue for another day. There may be selection of lower productivity blacks into the areas with a high share black. There may be more spillovers.
I have worked on racial stratification and networks. So if blacks are losing jobs in areas with a lot of blacks, then others don't find jobs. Who knows? Possible offset is if employers actually want to substitute away from blacks towards whites when the minimum wage goes up because they undervalue them, or they are less valuable.
That's easier to do in a place with a low share black than a high share black. If you're a very highly black area, you can't really substitute towards whites very easily. So those are all the motivations for looking at that, and let me just summarize. Because it's not there, we don't really find much in terms of spatial differences like the effects on whites, and the effects on blacks are very similar in very white areas and very black areas.
But that doesn't imply that the minimum wage doesn't have different effects across space. Why? Because the effects fall on blacks, and blacks live in black areas. So this job loss and the white areas have the 10th percentile white, 10 percentile black is like 2 point something percent black.
So it's almost there. I'm only talking whites and blacks here. So those are very white areas. So there's almost no job loss, even though the blacks there experience the same effect. They're really concentrated in black areas. And because of their skin color, that is where the race difference is occurring.
So real quick, on data, we use the ACS because we get big samples and because we had the spatial dimension, I wanted to have some geographic variation within states. We leave out Hispanics in this paper. If referees make us, we'll put them back in or not back, and we'll put them in.
I'm a little concerned about informal work and how that responds to the minimum wage and that being a whole other level of complication and knowing what people's status is. I think it's an interesting question. I'm just trying to, I always advise students, take on two controversial issues. You're just giving yourself an increased chance of getting your paper rejected, because it's one.
I only need one thing not to like to reject the paper. And I think this is more than important enough on its own without getting into that issue. What's important here? We use pumas, because in the public use data, you can identify them. A puma for those who don't know, they're typically about over 100,000 to 200,000 people.
So they're a lot bigger than tract tracts are. Think about 5,000 people. They're smaller than cities and big cities. They respect county and tract borders. And it's what you have. You can go to the confidential data, of course, get tracts which is probably too small for what we wanna do.
So this is what we've done for now.
>> Speaker 4: Do you know tenure on the job before they become unemployed? And one thing I wonder is whether if you're a firm, and they raise the minimum wage, then you start laying off workers, and typically it's last in, first out.
Right. And whether, how some of this could be related to that.
>> David Neumark: Right, so it's ACS data. So we don't know much. We know race, gender, marital status, kids, age, education, where they live, where they work. Yeah, you don't. There's nothing longitudinal, nothing even retrospective about that. But you're right.
And blacks, I will show you blacks are a lot younger than whites on average. So you would imagine that's to some extent true. And they probably lower employment.
>> Speaker 4: You could just compare.
>> David Neumark: Over time.
>> Speaker 4: From the CPS, obviously not linked to this, but just as an idea.
>> David Neumark: Just from the tenure supplements.
>> Speaker 4: For these kinds of people, how long is their tenure on the job?
>> David Neumark: Right, I will bet you it's generally very, I mean, 10. Yeah, you're right.
>> Speaker 4: That it might be a feature, a characteristic of black workers.
>> David Neumark: No, it's a good point.
>> Speaker 4: Than discrimination, specifically.
>> David Neumark: Right, agreed. No, that's a good point. That's a good point. Yeah, and we can see. I can measure tenure in the CPS tenure supplements by state, but that's fine. And by race, obviously. I can't see who's losing jobs in these databases. You're right, it's a good point.
>> Speaker 5: So how do you reconcile your findings with this data compared to the literature used in 1960s data and found more positive effects?
>> David Neumark: Well, I mean, there are positive effects on wages. So I mean, first of all, I'm not that concerned with reconciling from data 60 years old, but to the extent.
So the de Renault court and Montaglia paper and the Bailey DiNardo and third authors at the moment paper, they do almost the exact same thing. I remember these papers circulating at the same time with quite different answers. The Bailey et al paper uses as its employment measure, this is census data, so it's using any time employed last year.
And the other paper uses employed last week, and their argument is that employed last week is a much noisier measure. So I kind of buy that argument. I don't really know, but I'm not sure there's a reconciliation needed anyways because they do find some job loss. But we put a lot more scaffolding on the question, yeah, Brian.
>> Speaker 6: Going with pumas as opposed to aggregating into CZs or some other geographic unit.
>> David Neumark: So CZs are defined based on commuting, right? It's a sufficiently large share of people live and work in the same area. We're trying to get at racial segregation, so commuting zones have nothing to do with racial segregation, nor do pumas.
But I think at least the measurement of, I mean, I'm not sure comparing share black across CZs is really what we're after here. I mean, there'll be some variation, but probably largely the state variation at that point. Okay, wages are not central to the analysis, but just for the labor economists in the room, one of the things we don't like about the ACS is there's no hourly wage questions, right?
There's an annual earnings, there's weeks in categories and there's hours. We do some work with wages because I wanna talk about binding us to the minimum wage and I wanna talk about wage elasticities. We have this sort of long, interesting only to labor economist section about how we try to clean up the ACS data.
And it turns out, it looks like a non negligible, a somewhat sizable share of problem cases. And I remember someone telling me this about the CPS a long time ago. People in their hours reporting just sometimes add a zero and sometimes delete a zero and it turns out you can get a fair amount of mileage out of getting rid of outliers by kind of comparing wages, comparing an income and looking for hours ending in zero and seeing that's going on.
But not a big deal because at the end of the day we end up looking at employment and wages and then earnings and earnings. Earnings will of course capture employment effects, wage effects and hours effects because we include the zeros. So this turns out to be not that important, and I think that's my last data slide.
Good, okay, so let me show you some descriptives just to sort of think about what's going on here. Blacks are in lower wages, that's not surprising. But this is even conditioning on skills, so this graph here is. We have 18 or 20 groups floating around in this paper, I'm not gonna show you all of them.
We do teens, we do male and female teens, then we condition on low education, we condition on low age and combinations of low education and low age. I'm just gonna kinda flip through examples as I go the results, I'll show you where there is some variation. So this is males less than equal to high school under 30.
And these are just nominal wages at the time just to sort of, you can track everything and that's the wage gap, that probably doesn't surprise anyone. But the point is even condition on skill, black wages are lower. So if I run a regression for a low skilled group defined this way, I'm gonna find, I mean I might expect minimum wage to have a more negative impact.
The one exception is teens, black and white teen wages kind of overlap pretty closely. I think teens are not a very interesting group for looking at wages. As we say in the notes there, teens are very heterogeneous. Some teens have already dropped out of high school, some teens are gonna get PhDs, right?
A 25 year old out of school is, we know a lot more about them or 28 year old out of school than we do about just a teenager without conditioning on schooling.
>> Elena Pastorino: Sorry, dynamic population of teens in the year or you're following teens over circumflex.
>> David Neumark: Is this ACS, you get them once a year and you don't even know which month you get it.
ACS does not maddeningly tell you which month the survey is in, which I find weird, but I assume it's a confidentiality issue.
>> John Cochrane: This is earnings conditional on any one.
>> David Neumark: These are hourly wages, here I'm showing hourly wages. Yeah, just to show you what bindingness means for those.
Yeah, I mean assessing binding, this is always tricky because the minimum wage presumably has created some nonemployment and presumably it's the lowest wage people who are out. So black wages may be biased up more than white wages because of that, if they sort of underlying observed productivity is lower.
Yes, I don't know your name, sorry.
>> Speaker 8: Yeah, could you do something like the previous graph looking at the share who earn wages below, I assume you're gonna exploit reforms where minimum wages are increasing. Could you do something that's the share that are kind of previously earning below that mark or somewhere near it?
>> David Neumark: You mean a fraction effective treatment variable?
>> Speaker 8: Yeah.
>> David Neumark: We haven't done the fraction affected variable. I mean the problem with that always is that was sort of first used by Card, I believe, maybe it was somebody else, you never know. But in a case where there had been no minimum wage increases for a while.
So it's kind of a clean measure in an environment in this period, minimum wages are kind of going up repeatedly. So I'm not sure there's ever sort of a clean, you weren't affected and now the minimum wage went up and now you would be. The literature has moved away from using fraction affected and maybe that's why, maybe not.
I'm not exactly sure it's a good question, but think about it. Okay, so I showed you that. Okay, just some more descriptives. Blacks are younger, this is the age distribution. This doesn't condition anything, pretty striking difference actually. But perhaps not surprising, less surprising I think is the education differences, right?
So the no high school is green, some colleges, the high school is red, I guess college is blue. So quite big differences in some college and college going attendance as well as having less than high school education or high school. Probably high school dropout rates, although you wanna be careful calling it that for someone who's 19 years old maybe.
But you have those two differences clearly. Here's just some pictures of wage distributions. Well, these are, sorry, these are wage distributions but they're defined relative to the minimum wage. The spike is at 1, right? If the spike of the minimum wage, the spike is at 1 here. So if you look at everyone, and again this of course conditions on working minimum wages are a good deal more binding for blacks.
That's just a reflection of the wage difference, when you condition. So this one here is less than or equal to high school. Still see it a little less sharp perhaps, if you condition even more. So now you're doing males less than or equal to high school less than 30.
If you squint, you could see a bit more bindingness for blacks, but not a lot. So as you narrow the skill group, you tend to find less bindingness of minimum wages, less of a difference across the races. Which means, and I'm gonna come back to in a different way based on the regressions that same.
So this goes back to your question, I'm entering a ten year question cuz we sort of think about is it binding this, is it discrimination? This is a discrimination paper, it's a residual explanation, is it something else, is it industry you're in? And that's because at the end of the day, again with this caveat that I estimate bindingness for the people for whom I can observe wages.
It's not clear that minimum wages are, once I look at narrow skill group narrow groups that minimum wages are that much more binding. That's doesn't seem to be where the greater job loss is predominantly coming from. Hang on, hang on, John has the other part.
>> Speaker 4: In living service, restaurants, hospitality, what were these jobs?
>> David Neumark: I have some industry slides. I'm trying to remember if they have labels or just two digit codes on them, but a lot of them are in retail and restaurants. So I'm gonna show you some, I mean they're across the board but a lot of them for both, and the white and black distributions are not very different.
We do two digit NAICS industry shares for each of these different low skill groups. The correlations are like 0.98 or higher between whites and blacks. Thinking about this a lot sometimes when there's not an actual control for ladies service restaurants and people talk about restaurants employees and given tips and it's only really a subset of this.
>> Elena Pastorino: Must be in a certain type of establishment for the minimum wage to really matter.
>> David Neumark: Right, so that's right and I have some work on a much narrower topic. I think about the tip versus non tip restaurant sector. And you do find evidence of what you're saying that tip minimum wages, the quote unquote experiment there is compare the full service and limited service although now we're getting asked to tip everywhere so those things may break down.
I have this question, I've been trying to get to the CEO of Square to figure out whether more and more companies are classifying their workers as tip now cuz the standard is actually very low. It's $30 a month, usually when it's a paper cup they wouldn't know. And of course you could pay a much lower minimum wage, so another topic for another day.
Sorry, John.
>> John Cochrane: Makes it taxes now.
>> David Neumark: And we're all gonna be tipped.
>> John Cochrane: So many left of the minimum wage, I thought that's illegal.
>> David Neumark: It is, again these are computed wages. Yeah but even in the CPS if you look at hourly wages you see this. I mean part of it can be tipped, right, in the CPS you can actually break that out cuz you kind of get separate measures of what's reported as tips commissions and something else, bonuses, which the low skilled workers aren't getting.
So some can be a tip sector, there's a tiny uncovered sector, there's family businesses where these don't apply in it. And these are statement and wages and some states have somewhat bigger exemptions in some of the state laws, but I would guess that the most of it is poor measurement or non compliance.
In another paper I'm doing not with these kind of data, much more of a panel data thing. We noticed, not expecting it, that compliance is pretty good, but we're doing something with the SIP where we turn into monthly data. It kind of takes many months for workers wages to come up to the newly legislated minimum wages.
Now whether that's reporting or actual, of course I can't tell because all I see is the report. So it could be some of that short term, but I'm not sure, but it's not unusual, even in the CPS hourly wage data. Again less clear for teens, not clear at all those look virtually indistinguishable.
Okay, so what are the key takeaways from wages? Minimum wages are more binding for blacks than whites, which all else the same, predict stronger minimum wage employment effects. Another point is that even when, I didn't really mention this let me just flip back to one so we have it up here.
Let's just look at this one. Even when we look at teens who are the lowest wage group, there's a lot of workers above the minimum wage. You asked about those below, but there's a large fraction above and that always means that there's this point that makes, that I always try to make when I'm talking about minimum wages.
Which is that even a group that is very strongly affected, there's a lot of people whose wages are above the minimum wage. So when you think about an employment elasticity and is this small, there's a wage gain, does this imply the group gains? You wanna be careful because presumably it's only the low wage people in that group from whom that employment elasticity is being identified because it's a reduced form of elasticity.
It's the employment effect on the minimum wage. Many aren't affected so the right employment elasticity to apply to those whose wages are pushed up is probably a much bigger elasticity, roughly speaking. If a third of workers are affected, tripling it, for example, but not so important for here.
And there is this caveat, we see observed wages, not counterfactual wages. I had this thought last night, there's this old paper by Meyer and Wise where they estimate employment effects by assuming a parametric wage distribution and just seeing what's missing. I thought about whether it might make sense, you have to assume a functional form obviously to do that here.
But that can be problematic, my guess is that leads us to actually, if anything, overstate how binding minimum wages are for blacks in relative terms because more of them are sort of cut out of the labor market by the higher minimum wage. Okay, so now let's get into the more of the meat of this, this is the locational issue.
So this is the graph of residential racial segregation. I show you the 1 and 99th and then all the other 10, 20, 30 deciles here. It's highly nonlinear, and that's what I said before. Like at the 10th decile, which is the second point, the share white. This is just doing black and white shares that add to 100, I'm just leaving out other people for this graph wouldn't be that different.
10th decile is essentially all white, and then you get this sort of the 8th or 9th percentile and 99th percentile of course is almost exclusively black. But it is highly nonlinear, which is important for thinking about the stronger effects of unemployment of blacks and where geographically they're gonna be felt.
I will say, I should have mentioned this, John asked me before we started, why did you start working on this? I forgot the other reason I started working on this, now it comes. I get a lot of calls from reporters about minimum wages, not surprisingly, and occasionally they say, so does that mean we should get rid of the minimum wage?
And I've always given the sort of introductory econometrics book answer. The variance of the prediction error is bigger the further we are from the central tendency of the right hand side variables. So I'm willing to say if you cut the minimum wage 50 cents or a dollar or $2 or raised it, I have a pretty good idea what will happen.
So I give that answer, and then sometimes when I'm feeling a little more loose tongued, I'll say, but I do wonder, what ghetto neighborhoods would look like without a minimum wage, right? And this is not exactly about that, and we don't frame it that way in the paper, but I think that is another way to think about motivating this.
Okay, blacks live in areas with lower skilled and poor people, partly because blacks are lower skilled and poor. You can see that there, so, for example, the blacks live in places where the poverty rate's about a third higher than where whites live, and high school dropout rates is around 20% higher, etc.
So that goes to this question of why effects might differ by place as well. Employment rates are lower in areas with a high share black. So here I'm showing you all employment rates male, less than or equal to high school. Just as one example, very clear downward gradient.
It actually is true for. Yes. The employment rate, that's just the employment rate in the PUMA based on the percentile of the black distribution.
>> John Cochrane: That's the vertical scale.
>> David Neumark: That's the vertical scale,
>> John Cochrane: horizontal scale.
>> David Neumark: That's the percent black in the puma.
>> John Cochrane: In the puma.
>> David Neumark: Right, right.
>> John Cochrane: So it's down, it's hard to read.
>> David Neumark: It's going from like point. If I look at the all side, about 0.7 2.6% in the right hand side of the neighborhood. Right. Kate it's going, it's dropping from 6, roughly 65 to 50. Some pretty dramatic employment differences.
I'll come back and show you some of those later. So these neighborhoods are very different. Okay. And then if you do it by race, we kind of get this kind of weird stuff at the beginning, but that's where the black shares are so small. But what's kind of interesting here is white employ.
I mean this happens for both whites and blacks. Right. So both white and black employment rates fall. And to some extent, if you look at the less skilled group on the right hand side, it's actually only the, it's only the white line that slopes downward. So black on black employment rates are lower than whites.
You can see that in all these graphs, in both these graphs, but they're kind of lower everywhere. And the bigger difference in terms of as you move across pumas and go out pumas with a larger share of black is the white employment rate actually declines somewhat more. We have the slide in here.
Every time I read it, I keep thinking, how important is this? I'm not exactly sure, but the unemployment rates, when you convert things to minimum wage elasticities, the baseline employment rate you're using of course is influential. So I think it's good to have these in the background. Okay.
And then finally we just. I don't like HHIS as labor market concentration, but these are HHI measures based on the national establishment time series data, which is kind of Dun and Bradstreet data, which I've used in other work I do retail, food and accommodation and then a larger set of low wage sectors.
There's essentially no. And the top panel is the 10th percentile share black. The bottom panel is the 90th percentile. So you might think fewer businesses for workers, higher HHIs in black areas. But you don't really see a clear pattern here. And that may not be true because black areas are urban.
There may be other, you know, there may be more businesses because of higher density. So this was actually one of the, one of the thoughts originally. As some of you know there's a lot of work on monopsony and low wage labor markets and the relationship with minimum wages.
So we, we sort of were interested in whether there was any angle there, but there kind of isn't. So we don't do any more with this. We are in some other work unrelated to the race question. Okay, so now we can get to some. Yeah, sure. These are low, These are low HHIS, these are scaled to 10,000, right?
Yeah, they're really low. Which, I mean, it's this data set. I mean these are computed on different data sets. We're doing some other work on trying to get at this whole monopoly minimum wage thing we're trying to develop more sensible measures of labor market frictions like actual flows between jobs and see what we get.
And I can't summarize results yet because we don't know what they are yet. But again, HHIs, I don't know. This is labor market power, product market power. Right. And they have opposite predictions for the, I think for the effects of minimum wages. Okay, so now we can get to the core stuff.
So this is just the usual minimum wage employment regression. There's an employment rate on the left hand side, there's a log. Minimum wage. X is some demographic controls that might drop out when we disaggregate. By those there's PUMA and state dummies. Sorry, PUMA and year dummies. And the only difference here is there's a black dummy.
So that could just be one of the X's. So this is just to get a baseline relative to what people have typically done without yet looking at race differences in the employment effects. No, that's actually not too small. Okay, I'm going to walk through a few tables, but I don't really need to bore you with all of them.
The bottom line is I've highlighted in gray the standard employment effect. And then I guess I didn't highlight the employment elasticity. Maybe I should have the second to last column. So people say when you look at teens, high school dropouts, 16 to 24 year olds, people including me, you elasticity to minus 0.1 to minus 0.2 are kind of what you expect.
So these elasticities they're negative for teens. They're small, very small. Negative. They're on the low side for sure. And the employment effects, this is ACS data are actually not significant which is different from what you get in some other data sets. But this is somewhat more recent data than most people have looked at.
So the baseline. If you were just doing a minimum wage employment effect kind of standard paper and saying let me just see what I get in the ACS instead of a longer spell for the CPS because the ACS doesn't go back further, you'd say yeah, it looks negative but weaker than what people have found before.
And those are not significant, which some people make hay out of. And that's fine. And here's just some other groups. So here the bottom ones are more interesting. Here we're doing both education and age. And again the elasticities are. They're all staying low. I don't think there's any in this analysis which is the whites and blacks combined where the elasticity is bigger, negative.
It was confusing to say bigger here than minus 0.1. So these are low relative to other work. I would say. Talk about space out of which you grow literally sometimes I feel that the study limited on which for teens, white teens, I agree.
>> Elena Pastorino: For Afro Americans perhaps it's a different story I was curious about.
>> David Neumark: Well, okay. I mean it's an interesting question. I remember when sitting at a hearing and we were, we were this, we were debating the whole, this is back in like the Karl Krueger stuff. And we got this whole back and forth unemployment of expertise and at one point I said what you just said, like it doesn't really matter what happens.
Like I mean if you're throwing 30 year old single mothers out of work, that's a problem probably, but we should probably looking at poverty rates or things like that anyways. I think historically the reason people focused on teens is when people were doing all the time series stuff, you know, kind of up to the work summarized in the famous Brown et al Survey we had time series data and if you're going to look for.
And one of those was 16 to 19 year olds like it still is for the BLS off of nd if people wanted to think about a group where you might see anything that was the group they looked at. You didn't have sort of age by schooling breakdowns in the published data.
But I agree with microdata. They're less interesting, I think. I mean, you said more important for blacks. I mean, I think the reason they're interesting is I'm less concerned if teens lose their job in the short run. I'm more concerned if it forecloses you from acquiring labor market experience.
I have other work that says it does. I'm less concerned if you're in school instead. I'm more concerned if you're just doing neither instead. And I have some work that says that's the outcome, that's older. So maybe that's not true anymore. I haven't yet seen any work that says we're pushing people out of work, but they're acquiring skills instead.
So in that sense, it's a concern. On the other hand, maybe it's efficient. Well, I mean, yeah, it's inefficient in the sense that these people have very low productivity of time outside of work. So in that sense, I think we talked about this before. I was looking at, let's say, mothers with young kids versus teenagers.
I'd much rather the teenagers work and the mothers not work from an efficiency perspective in terms of the value of time.
>> Elena Pastorino: Not the dependence? Yeah, cuz a team would depend on
>> David Neumark: You do know the dependency, there aren't many of those. I mean, is low, but yeah, you do know that I haven't anything with family records except the number of children variables.
Okay, so now we turn to what is in some sense the most interesting, which is putting in these black interactions. So all what we're doing, this is a fully interactive model. I could just as well run two separate models for whites and blacks. Just makes it nice and easy to test for differences across coefficients here.
Everything interacted, the controls, the minimum wage, the dummies and all that. How to interpret the coefficients? In terms of identification, well, I'll talk more about this later, but the whole debate with Aaron Dubay and all these folks is about are there correlated shocks that are confounding minimum wage effects?
Won't get into all those details here, but if you think the shocks are the same for whites and blacks, then at least the relative effects you're estimating for blacks are reliable. And maybe the white coefficients are picking up both effects of minimum wages and whatever else is correlated with the shocks.
If you read this, Casey and Minton's paper, just came out, the NBR Sunday paper about what in the macro context, they call the missing intercept, right? The point being that all these strategies only estimate relative effects. And unless you're willing to take a strong stand on no confounders, I don't know that the beta is actually the coefficient for whites.
I'm not bad interested in this paper.
>> John Cochrane: Let me just understand. There's no dip and dip here. This is just a panel data set, unit of observations. They personally have a year, is that right?
>> David Neumark: Everything is right except it's a triple diff, actually, right? So the previous regression, it's a different diff because minimum wages are changing differentially, right?
You're always asked, I mean, it's not a symbol dummy to the minimum wage increase. But I mean a panel data with policy changes is essentially, it's two-way fixed effects but I always- Sorry.
>> Speaker 4: Yeah.
>> David Neumark: Sorry, you're right, I should leave those out here.
>> John Cochrane: I don't know why-
>> David Neumark: I leave those out here. Yeah, we have individuals by Puma. Think of it as state. It's no less confusing and you, right? So minimum wages are changing differentially over time. So you're identifying how differently employment is changing for people with the same axis and then you're getting a.
And they're changing a lot in this, I'll show you. And they're changing a lot, and then I'm doing the triple diff cuz once you put in the minimum wage times black there's a differential effect for blacks versus whites.
>> John Cochrane: Regression is just unit is a person.
>> David Neumark: Yes.
>> John Cochrane: Minimum wage applies to that person.
>> David Neumark: In that puma at that point in time, right? You could do this aggregated to the Puma by period level. Yeah, sorry, I don't know why I left subscripts off here.
>> Speaker 5: Sorry, I'm inconveniently sitting behind you. But there are no individual fixed effects in here, right?
>> David Neumark: You can't. I mean, there's no repeated observations.
>> Speaker 5: Exactly.
>> David Neumark: It's the ACS.
>> Speaker 5: Exactly. So you have two-way fixed effects model but in the sense that you will have tumor fixed effects and time fixed effects.
>> David Neumark: Yeah, which is why I could aggregate, and then I could construct the controls of shares, and you'd get very similar results.
>> Speaker 5: Is it possible to do the same as an event study?
>> David Neumark: Well, I mean, this is a whole nother debate. We were talking about the JP Micro paper, which is all about this. I mean there's a lot of events here and there aren't a lot of clean events.
But I'm gonna come back to some of these issues and show you a pseudo version of that post 2010 where now I can talk about a bunch of never treated states, and you get a very nice visual display of what's going on. Is there a way that I mean you could aggregate them.
You could aggregate them by period of geography.
>> John Cochrane: But alpha has time.
>> David Neumark: Well, those are the DPs and the DTs. Alpha here is just an intercept, I'm sorry. Pumas are puma dummies, the DT are PUMA dummies and the DT are time dummies. And they all differ by race.
They can differ by race.
>> Speaker 10: Do you know what the standard errors at state level is?
>> David Neumark: I believe we do it at the Puma level because the variation. There's a fair amount of local minimum wage variation these days. I don't think it matters. Jyotsana, do we do PUMA state?
Do you remember? I can't actually recall sitting here clustering.
>> Jyotsana Kala: We do state.
>> David Neumark: Okay, yes.
>> Speaker 11: One question in the back of my mind, by the way, everybody talks about minimum wages, that minimum wage is a nominal thing, and yet cost of living wage rates, etc., differ a great deal across the country.
Even within the state of California, which recently had some minimum wage changes. The impact of a minimum wage increase around here is probably zilch, but much more likely to be significant in the valley. Now, does any of this is controlled here? I presume not everything.
>> David Neumark: Well, so there's no, I mean, in the older minimum wage literature, which sort of grew up in the late 80s, there was a lot more inflation until recently there was more, but not as much as then.
So people were typically using some kind of normalized minimum wage, what they call a Gates index. So here we're not explicitly measuring any of that variation within Puma and year. But the Puma dummies and the time means you'll get both the cross-sectional and the time series-
>> Speaker 11: Puma dummies will sort of capture-
>> David Neumark: That'll do San Francisco versus Central Valley unless somehow there's changes.
>> Speaker 11: Yeah, that will be my concern.
>> David Neumark: Yeah, any price index. Cuz it's a log minimum wage, so any price index that varies only by Puma, only time will get fully absorbed in this. Okay, not the interactions, right?
There's differential changes, right? That's why people used to divide by sort of a wage level, but kind of with at least the subsides of inflation for a long time. People stopped doing that, but yeah. Okay, so this is now in some sense core results, although there's a lot more, I promise you.
So now you're getting the employment effect for whites. That's the beta. And this is the black minimum wage interaction. That's the overall effect, which is just the sum of these two things. So now you can see the big difference. The white employment effect, let's say teens, minus 0.014 for blacks, minus 0.064, significant of the 5%.
Jump over to elasticities minus 0.039 for whites. So, close to zero for sure. All negative, but minus 0.283 for blacks. It's a big difference. Male teens, minus 0.353, female teens, minus 0.249. We tend to see that pattern. I don't know about every single case, but we tend to see more of this for black men than for black women, which I think doesn't surprise some people because race differences in earnings between women Are smaller than race difference earnings between men, which may speak to productivity, which by the way is the exact opposite of what people mean when they talk about intersectional discrimination.
I have another paper on that that we can't find any evidence of intersectional discrimination, even though half the papers and literature claim it's there. Okay, anyways, that's an aside, when we just do age, I mean you're always finding differences. But when you do age by schooling, which is this slide here, sorry, gets crowded.
So now you've got a sharper low school group, high school dropouts under 30, a whole bunch of alternatives here. Again, a lot of zeros for whites effectively and elasticities, I think the biggest one here is this one right here, mine is 0.418. Get these big elasticities for blacks and again typically somewhat bigger, not significant, so for men than for women.
That is in some sense, the simple first punchline and maybe the main punchline of the paper. Yosta and I had this result probably in March and I kept saying you did something wrong, but she didn't, I didn't, we didn't.
>> John Cochrane: Just in terms of interpreting what this is, could partly just reflect the figures you showed earlier.
>> Speaker 12: There's a much bigger density of black workers below minimum wages, right? And so-
>> David Neumark: Yes, although it's-
>> Speaker 12: Two things both risk and then potentially you think that the actual elasticity of them is different for blacks and whites, right?
>> David Neumark: That's right, I mean, the paper is not fully about mechanism, we try to say something about that, you may not remember this because I'm showing you a lot of stuff, I realize.
But once I condition on both education and age, the spike difference is a lot milder. I'm gonna show you a figure later after I zip through the spatial stuff that's gonna make really clear that insofar as you can tell, because I'm looking at observed wages. I'll jump to it now, and I'll jump back because it's a striking graph, since I've got these arrows mastered.
I just want to show you this, so this is gonna be a summary of what we do when we estimate effects. The bottom line is we estimate effects by these deciles by percent share black. I like this graph, I like lots of dimensions to grasp, I know I stopped for a second and say what the hell is going on in this graph?
But I remember, okay, so, these here are the black estimates and comps intervals of the employment effect. This is for male high school dropouts, this is less than high school under 30. So there's the black elasticities in this case down in the O minus 0.3 range, generally significant.
Not much change, that's what I said across the distribution of share black in the puma, the white estimates are right near zero. You can see them there because they have dots and confidence intervals. And these are the shares white declining and the share black increasing. So that's that same figure I showed you, that non linearity of the segregation.
>> Speaker 12: It's interesting in terms of mechanisms because the risk mechanism is very clear that just mechanically-
>> David Neumark: Right, I'm gonna show you one of the graph that gets directly at what you're saying, and then I'm gonna back up. So this is the one that I think is the clearest, so here I'm showing you a lot of groups, this again isn't all of them because it's just too many to crowd in.
So what I'm showing you here, the blue bars are the proportion whose wages are under 110% of the minimum wage. So here's teens, pair of blue bars, notice each of those pairs kind of the same height, a little higher for blacks, a little more binding some cases, but here not.
And the reds are the estimates, the closest zeros for whites, big negatives for blacks. I look at this and say again, with the caveat that they're observed wages, which might be important. I mean, I'm sure, qualitative, I know which direction it goes, I don't know how big it is.
You're not seeing this, at least in terms of observed bindingness among those still working. These differences seem very unlikely to explain these differences, kind of what I'm getting at.
>> John Cochrane: Interesting in terms of the mechanisms, right?
>> Speaker 12: Because theories of discrimination might explain why wages are lower for one group than another.
But if it's not driven by the differential exposure, it's a theory of discrimination where the elasticity of employment with respect to wages is different. And that's a more subtle moment, so it's interesting thinking what do your findings imply-
>> David Neumark: Right.
>> Speaker 12: For discrimination or other reasons why-
>> David Neumark: Right, so we come down on lightly because we don't have direct evidence and discrimination is probably the most plausible explanation rumor.
So we used to think about wages, but in a minimum wage world that's not the right way to think about it because minimum wage provides a floor, right? So if I have a minimum wage that binds me and I would have been a classic employer, a backer employer model would have paid the minorities less.
I can't, so I instead I don't hire them, and that also undoes the competition effects that might reduce discrimination. But let's go back to that because I jumped ahead just to show you that.
>> Elena Pastorino: So it could be, let me try this, so a lower level of education means a lower degree reportability of human capital.
So a minimum wage increases the the price of certain types of versus others, and a person with higher human capital who we happen to identify with more likely to be white.
>> David Neumark: Right, this could all be unobserved human capital.
>> David Neumark: Right, I mean unobserved- Right, unobserved school quality differences, I mean, I'm sure they exist, I'm sure they're in that direction, I just don't have a good handle on how big they are.
And I want to be careful not to assume they're really big because maybe they're not that big, I don't know. There's a stereotype, certainly we talk about that as well, I mean, just a condition on age and education, I mean age is measured correctly presumably. But the same years of education can mean different things for blacks and whites.
Although I would have thought that the whites in black areas, well, they may not be going to the same schools, but you're not finding bigger employment effects in the high share black areas. And if it's all school quality and the whites are still going to the same schools, and maybe they're not, maybe they go to Catholic schools in black areas.
So it could be more complicated, you might expect some differences across areas in minimum wage elasticities, but again, I'm not sure, and we're speculating on those things. I mean, this opens up a lot of questions which I hadn't anticipated getting into, but I probably will because it's kind of interesting.
Okay, so here is where I skipped over the regression, but I think it's obvious, I'll just show you here. Now we also add interactions of everything with the percent black and the puma. So now I've got a white effect, an interaction for blacks and whites and an interaction of the minimum wage effect with the percent black.
And what I'm showing you here, it's interaction now, so there's a lot of coefficients. So I'm showing you here these sets of estimates of the 10th, 50th and 90th percentile. And if you come to either white or the black employment elasticities by that percentile, they just don't differ that much.
It's kind of the graph I showed you before, those estimates were pretty flat. Maybe a bit of an increasing negative estimate like here gets a little more negative. But these are not differences I would write home about the black white employment necessity. Differences are not that different across low share black and high share black areas.
So that's where we ended up saying there's not a lot going on here, and I just have a lot more of these tables, and they all say the same thing. So that's how I got to this graph, that was the summary of that graph. I want to make the point though that that doesn't mean black areas aren't hit hardest.
They're hit really hard because that's where blacks live, blacks are hit and blacks live in black areas, if there's no Segregation, that wouldn't be the case, but there's extreme residential segregation. So this is just sort of a, simulation is too fancy a word. Back then, vote calculation is probably more accurate.
So all we do here is we take the. God, it doesn't say it anywhere on here. We just made this figure. This, this is, this is black high school are under 30 years old. Right, Yotsna. Yeah, okay. We were making this table yesterday and we left out. Left out that importantly.
But we're using the estimates for them. This is like the estimates where we don't have effects that differ by percent black. And here we do. That doesn't matter much. But let me just show you what, what goes on here. So here's just the white population share at the 10th percentile.
Black, it's almost 100% or 1. Almost no, blacks at the, at the 90th percentile, the share black. The black share is 0.56. I mean, the 99th, of course, would be a lot higher. So population shares not surprisingly, differ a lot. Employment rates, you can see they're lower for blacks everywhere.
And then for whites. But the gradient, I showed you that figure before is steeper for whites than for blacks. Okay, then we have a weighted employment rate, and here we have the elasticities for whites and for blacks. And these are different in the two columns because you're applying them to slightly different employment rates.
Okay, I meant to walk through this. Sorry, all right, color coded. There you go. So there's the employment rates, there's the elasticities, and this last row is what is what happens to the employment rate. What I do here is a seven and a quarter. That's the federal minimum to 12.
That was the California minimum when the data ended 2019. A lot of states are above 12. And not just the old coastal liberal states anymore. I mean, this is not at all uncommon. So this is sort of saying 4, 8, and whereas 22 or so states this changes every January 1st hour are still at the federal minimum.
So this is sort of a pretty close now to a representative minimum wage increase, right? And perhaps even on the low side. And what this says is that in white areas, the sort of simulated effect on the employment rate is close to zero because you're applying the small elasticities to people who are mainly white.
1 second in black areas, the employment rate from that, you know, this is. It would be lower by 3 percentage points on a difference of 12.1, if I'm doing the math right. So if you take this back of the envelope calculation a little seriously these kinds of minimum wage variations which exist now across states, even bigger, they're not the whole difference for the employment rate difference.
And I'm sure there's a lot of other factors in these neighborhoods, but this is a pretty big share of 12. It's 25% of it. Which says these minimum wage effects in areas with a high share black can be playing a significant role in how much lower employment is in those areas.
>> Speaker 13: Sorry if I missed this earlier. So these are employment rates for people with education lower than a high school degree. You're removing from this employment rate people who are enrolled in school.
>> David Neumark: No, but these are not just teenagers. Right. So this is, that's very few people, I mean under 30,
>> Speaker 13: but maybe in the, in the category of less education than a high school graduate. And if you go to yours figure on slide 4 times 50.
>> David Neumark: I'm not sure why, I mean. Sorry, which one?
>> Speaker 13: Yeah, it looks like most of the effect for less than high school degree under 30 is being less than high school.
>> David Neumark: And let's just get everyone on the same bar less than high school under 30 right here.
>> Speaker 13: The red bars are much smaller for all of the age categories under over teenagers. So if the-
>> David Neumark: You're comparing these three. Let me just get everyone caught up here.
So these are people who have less than a high school degree when we observe them. And they're underage, 30, all gender and my gender. And these are the teens. And you're saying these elasticities are bigger than these?
>> Speaker 13: They're closer. So the-
>> David Neumark: Closer to what?
>> Speaker 13: So sorry, the elasticities for the group under 30 with less than a high school education is much closer to the elasticity estimates for teens than it is for people who are over 19.
Suggesting that if this is kind of a weighted average of individuals who are teenagers and in their 20s, to get that aggregate effect, it's got to be driven by the teenagers.
>> David Neumark: Quite sure why it can't be driven by the 19 or 30 year olds. Yeah, I mean, I'm not sure that's right.
But I'm not saying, I'm not sure it's not right either. So I'm being non-committal, but I think, I mean you could leave out the enrolled. I'm not sure you should. I mean, a lot of people in school at these ages also work. I actually, my, my original. This is going back a long time.
This is my earliest PTSD in the minimum wage literature was I got skewered for leaving out the enrolled people by Cardcatz and Kruger. But let me think about it. I mean, it couldn't hurt to do that, see if it looks any different. Certainly. Yeah, I have to think more about what exactly I'd make.
But that makes sense. Okay. Yes.
>> Speaker 4: Going back to. Not this part. An interesting follow up would be to see what happens to the crime rate in predominantly black neighborhoods after an increase in the minimum wage.
>> David Neumark: Yeah, so I don't think, I mean, there are some papers on minimum wages and crime.
I don't know there's any at the Puma. I published this. So I get a lot of emails with minimum wage papers. I'm sure you get. You know, this happens to all of us depending on what we work on. Right. And I started getting all these papers on minimum wages and like heart attack rates and suicides and all kinds of things.
And I said, what is going. A lot of public health journals and some of them are. I said I'm gonna like just write a survey paper on what all these papers are saying. And I don't know where I'm gonna publish it, but I actually publish it in labor, which is an okay labor journal.
And I call it the Effects of Minimum Wages on parentheses almost everything. And crime, it's like health and risky behaviors kind of thing. And crime is actually one of those where there's conflicting evidence. But I kind of think the best evidence says you do get some interested in crime.
Josephia San Diego State has done probably some of the best work on that. It's never been tied to race. You wanna get me in more trouble, right? Yeah, no, it's. Right.
>> Speaker 4: Well, it's also-
>> David Neumark: No, it's an interesting question and it should be local.
>> Speaker 4: So it also helps support your employment.
>> David Neumark: Right, I mean, you would think that would be a somewhat local effect. And then people are doing things like you expect like, you know, property crime. You're probably not murdering people cuz of minimum wage, but you might be stealing money. Or stealing things you can get money for.
Yeah, that's an interesting point. Right.
>> Speaker 4: Murder rate could go up
>> David Neumark: true. But I think these papers tend to say we're gonna sort of control for other changes by focusing on the pecuniary. This is comedy. This is kind of literally the pecuniary motivations for crime. But you're right.
Okay, so here, I just want to show you some. Some evidence. Yes, sorry.
>> David Neumark: No problem.
>> Speaker 5: About parallel trends. So I guess-
>> David Neumark: That's coming. Wait, hang on, did I skip. Wait a second. I did skip over that because, why did I skip over that? No, I skipped over that.
Sorry, yes. I got a question. And, yes. Let me come back to yes. Okay, so this is what Know about, right?
>> Speaker 5: Yeah, let's see, I don't know.
>> David Neumark: Okay, yes, let me go, okay. So if you're a minimum wage work under 30, this is bad news. But as every PhD student and professor under 30 knows, there's all these different diff concerns and depending on your age you worry about this more or less as far as I can tell from the regressions I've been running.
But what it does highlight is there are potential problems with panel data that people, well, according to this literature people haven't thought about before, I think that's completely inaccurate. I think people have often said what if I leave out? What if I look compare early adopters and late adopters.
What if I look at only the ever treated. I think what this has done is systematize what people do instead of pointing out this. There's this paradigm in this literature where people are stupidly putting in a dummy and running a diff and diff and not thinking about the data at all.
And that's not how people do research. But anyways you can't ignore these issues anymore. So now our first line of defense is we're looking at race differences. So unless you have sort of differential pre-trends or something by race, this stuff should be netted out, right? Of course, they could differ by race that's an identifying assumption you could make.
The key concern is what I say right here was black employment in treated areas falling in relative terms before the minimum wage increases. I mean that's in some sense the bottom line source of confounder you're worried about. So did two things, one is even though estimating leads and lags is not 100% kosher in this literature, but I still think it's informative.
We do that we can't use a lot of them. It's not that long a panel. We have to go to the state level because there's a puma's change mid sample. So we go to the state level instead of puma level. That doesn't affect the estimates. So then we do sort of some long ish leads and lags.
There's no clear evidence of pre treatment changes for blacks relative to whites. I think more interesting though is cuz I think it's cleaner to what this literature tries to do. And I'd say I've been involved in a bunch of debates over this stuff in other research and I kinda feel like what we're ending up doing is visual econometrics instead of formal econometrics to figure this out, which maybe isn't a bad thing to look at actually look at the data, the ocular, sorry, not.
That's the scientific term, okay. So what we do is we take the sub period post Great Recession 2011 and 19. Why? Because there were federal increases in 0708 09. So then you had a, you had. And then you have a bunch of states with no changes after that either because they were the federal or a few that were higher but didn't change.
And then because there were these federal changes, a lot of states, even the one states that like high minimum wages were kinda okay for a while, but then they started raising the minimum wage later. So you have a never treated group of states and you have a bunch of other states where there's sort of no higher minimum wages, no changes.
But then they start to roll out minimum wage increases. And that gives you a nice way to look at kind of pre-trends and also kind of see how things are changing for these states that are cumulative rolling out more and more minimum wage increases from 2011 to 2019 relative to the other states.
And let me show you what happens here. Pretty interesting. I don't know which graph is easier to read, so I'll show you a couple. And again there's a bunch of these. Here's some examples. These are teens. So at 2011, 2019, I'm showing you white and black. That's the two lines up here and two lines down here.
Employment rates over time. The reds are the never treated. These are these whatever it is, 22 states, 25 for whatever is that never change the minimum wage. These are the dashed lines of the ever treated. And you can see here the number of states. This is the number of minimum wage increases by year.
It's not the cumulative number cuz it goes down. So there's as you get later in this period, you have more and more states that have raised the minimum wage. Some of these are new, some of these are repeat increases in the same state. So what do you see here?
Well, first of all, if you look at the black employment rate in the never treated versus ever treated. I mean I don't see any in this first few years any differential trend there. This is ocular. I realize the other thing you see if you peer hard, it's easier in the next graph is that these lines stay parallel.
That's the nothing happening to whites when the minimum wage goes up in the ever treated versus never treated. But what happens here? Well, the ever treated as the minimum wages start to accumulate, fall below the never treated, right, which is an adverse minimum wage effect. If you turn this into differences.
But these are now race differences, never treated, ever treated. You can see again there's, you know, if you want to call this, I don't know what the pre treatment period is exactly, but this period, there's no differential slope here. And then again, what you see here is the red line is going up.
So the black white difference is narrowing in this period. Now, what's going on in this period? 16 to 19, a huge economic boom, right? What happens in economic booms? Minorities catch up, right? We see that every time. And we saw that in the Clinton boom, we saw the Trump boom.
I hate to name booms after presidents cuz t's never their credit, but whatever, it doesn't matter. That's what happens in booms, right? There's old George Perry Brookings paper about this. So in the never treated states, as the economy is tightening, remember, this is the black minus white difference, right?
The black white employment gap is shrinking. In the ever treated states, nothing's happening. They're not getting that benefit. If you look at male high school, under 30, male less than high school, under 30, you kind of see again, these look pretty good to me. And again you see the sort of gap closing during the boom and this is actually going the other direction.
And I think there's one more, this one's kind of extreme. I'm not sure I quite believe this kind of decline, but same qualitative picture. So I think the picture here is, you know, this is sort of a nice period. It's a cleaner experiment, it's a bit more immune from some of the problems literature identifies.
I mean we could do, it can do an event study, it could do this econometrically, but I think the graph is pretty telling. And you kind of have this oops, this Trump period boom where things are improving for blacks relative to whites, but it ain't happening. Again maybe it's even reversing in the states that are raising the minimum wages a lot, yeah.
>> John Cochrane: Two questions, one, a similar dynamic. It looks like we're just saying minimum wage boom, employment. But if this takes time, it takes time to put in the self order, whatever.
>> David Neumark: Right.
>> John Cochrane: Then there's a dynamic and you would never catch that dynamic effect. So you're assuming it's the same effect instantly without dynamics, right?
>> David Neumark: I'm not estimating lag models here. There is work that says that happens. I don't know if I have the riches here, and I think it happens in some job. I'm embarrassed I went to McDonald's for coffee yesterday cuz I was driving and I really wanted a coffee.
You can't even order at the counter. You can't order at the counter. And I have a PhD and I could not figure out how to work the machine. There were two homeless people in there who knew how to work the machine, right? It was a little embarrassing.
>> John Cochrane: So of people, the decline in employment, what happens?
This is partly dynamic, too, I mean, they can't just sit there for the rest of their lives. Is move out one of the reactions, or?
>> David Neumark: Geographically move out? Yeah, I mean.
>> David Neumark: Right.
>> John Cochrane: Prime age man, what are you gonna do with the rest of your life?
>> David Neumark: Well, I mean, mobility is a potential response. I mean, I have to say, I've worked on papers and of course, read a lot more on local policies, from welfare to minimum wages or whatever. My sense is mobility responses, there's just not that much interstate mobility.
>> John Cochrane: Variable.
>> David Neumark: Right.
>> John Cochrane: Number?
>> David Neumark: Yeah. No, it's an employment-population ratio, so population move.
>> John Cochrane: So moving out of the bad area is not gonna help the employment?
>> David Neumark: Well, no, the jobless people go somewhere else then the people at jobs stay, the employment-population ratio would go up, right?
>> David Neumark: I'm sorry, here it's the employment yeah, sorry, it's not a rate, it's a dummy for the employed. But if they're not employed, move out in response to the minimum wage, I mean that's gonna bias the estimate towards zero. Yeah, that's gonna bias the estimate towards zero. But we know there's a lot of non-employment in place, I mean Austin Glazer Summers paper is all about that.
I mentioned this earlier work I did, which kinda hope someone else redoes it cuz I want to redo it, you look at sort of younger people back to your question about enrollment. They're in school and employed, only one, only the other or neither which we call idle. And just you do see more people who are just idle after the minimum wage goes up.
Now maybe it's illicit activity, maybe it's informal activity. That's why I think for the Hispanics I'm a little more reluctant to kinda play this game because there's a lot of informal work.
>> John Cochrane: Part of the frustration with just elasticity concept which isn't either preferences or technology. Some people substitute out of work and go back to school for a little while.
Other people don't, and that's a lot of what we mean.
>> David Neumark: My guess is a lot of this population. I mean I haven't done idleness regressions, I think we could and I bet we'd find that, but it's a good question.
>> Speaker 4: You exclude the ones who are employed in a family firm and all of those- Not for employment, no, this is all, yeah, so that's all in here only for wages, okay.
>> Elena Pastorino: So given the debate, 30, 40 years long is so to speak about this so-called first stage, we're talking about it a little bit.
>> David Neumark: 100 there's papers from the 20s.
>> Elena Pastorino: So to you-
>> David Neumark: You had a question before I do, I forgot, sorry, go ahead, go ahead Elena I just browse choreography.
>> Elena Pastorino: The best so to speak, some of the literature that you like where you think is converging to.
>> David Neumark: You're asking me?
>> Elena Pastorino: Spatial controls cross country.
>> David Neumark: Yeah.
>> Elena Pastorino: Cross county the non minimum wage obsessed among all of us. I mean there are issues of measure fundamental issue.
>> David Neumark: What do I think is converging in terms of answer or methods?
>> Elena Pastorino: Where is the issue? How do we identify control population how to measure.
>> David Neumark: I mean I kind of think, first of all you're asking the wrong person obviously cuz I skin in the game. But I do think the debate on whether job loss is or should be regarded as kind of over there is some job loss.
I mean it's just few studies that don't find it and I think the major ones have problems. I think the spatial control thing has turned out to be misleading and not convincing cuz otherwise I mean the people who raised that who first said minimum wage variation isn't really random.
So we should think about when we run panel data models thinking about what drives the variation. But the spatial a lot of other approaches aside from the spatial approach I talked about classical liberal seminar bit. All the other ways of getting at that kind of replicate the negative employment effects the spatial one doesn't and I think there's reasons why so that's my sense.
But I'm done with Bob's question.
>> Bob Hall: Just to comment, right, labor economists are only allowed to think about Epop, the employment population ratio. It's against the rules of labor economics. I've seen this over and over and over in my career as a macroeconomist interested in labor markets. But unemployment is something to be taken seriously and it's something that you miss if you look at Epop.
But you did mention one paper that takes my position the one with Larry Summers. He's always been properly tuned in this. Could I ask you, that's not a question, that's just a comment.
>> David Neumark: I thought Larry Summers, I mean I seem to remember him saying that unemployment out of the labor force are not very well defined cuz people move.
He has this famous paper with somebody Kim that people just move back and forth month to month. If you look at outcome rotation.
>> Bob Hall: That's what unemployment is about.
>> David Neumark: No, no, no, but I mean that whether you're searching or not is makes you unemployed or not and I think so, I mean I'm not appealing newspaper, right?
I wasn't sure he was so clearly focused on unemployment as the most important concept. But I do think that the reason the labor economists have moved away from unemployment, it goes back to this early mincer paper from the mid-70s. Where it's a precursor to search models, which of course got much more complicated since then.
But he's just sort of weighing the probability of finding a job multiplied by the wage of that job and says people may, depending on what they think, search more, search less, and the unemployment rate. Even though jobs fall, the unemployment rate could go up or could go down depending on search responses.
So that's, I think, why people are focused on employment.
>> Bob Hall: There's one question.
>> David Neumark: I'm doing a search paper now, but that's for another day.
>> Bob Hall: Go ahead.
>> Speaker 15: So I find the paper fascinating. And there's one question that I think you could address that you've been unable to until now, and that's whether or not it's human capital or discrimination.
It's come up in the conversation and you're saying you can't choose between the two, but you could, if you could get information which is publicly available for every school by race. So we know what the test scores are in eighth grade or high school or whatever grade level you wanna pick.
We know what the proficiency rates are in the different states, you can norm that on national data. So you could have an estimate of the differential between white human capital and black human capital. And you could be a lot of work, but you could connect that to your Puma data.
>> David Neumark: Yeah.
>> Speaker 15: And then you could actually get an estimate, I think so.
>> David Neumark: No, you're right, you're right, I mean, the VAL was saying this before, yeah. Right, we're not completely blind about school quality anymore, there's a lot of data being produced and at least.
>> Speaker 15: The school quality data, you can use expenditures and all that kind of stuff, which is what you usually.
>> David Neumark: I mean, I'm thinking of output or value added or something, right, I guess output is, yeah, so the quality, right, I'm conditioning.
>> Speaker 15: Just have a beta, you don't need the value added data, you just need level data.
>> David Neumark: You're right.
>> Speaker 15: An estimate of human capital.
>> David Neumark: Right, you want a proficiency difference conditional on observable levels, levels of schooling, yeah, I agree, it's a great idea. Yeah, let me just say a couple things, I'm not gonna get through everything, I won't even get to my concluding slide. But I did wanna just say real quickly, I had this slide up here which I just wanna say something about and show you one more table.
Okay, there's a bunch of these, but this is just we take all the groups, we throw them on a graph with the wage elasticities and the employment elasticities. And you can't see here, but they're dark, whether they're significant and not when they're not. And what you see here is the wage elasticities, if you go along the horizontal axis, they're kind of in the same place, more or less.
The whites are actually slightly higher on average, the employment elasticities are really different. Right, the white, these are on the same scale, right? So that's this close to zero, white employment elasticities. The other thing you see on the right hand side is the wage elasticities and the employment elasticities are roughly speaking, the same order of magnitude.
Whereas people have tended to think wage elasticities are bigger and therefore even a bit of wages caused some job loss, earnings don't fall or maybe, maybe rise. I just wanna show you, so the suggestion from that is earnings of blacks fall. I just wanna show you the table, and we're skipping the stuff, we sort of talked about it.
This is just effects on earnings, so these are the same regressions, we have a white and black earnings elasticity. The white elasticities are either zero or positive, there's a couple of cases here, there's other tables. So that's zero or somewhat positive. For blacks, you're getting these pretty big.
Here's the teen earning lessons, they're kind of -0.4, -0.5, which are huge. Here's, and here's the age by education is this one. Again, you do the age by education, all this, 30, high school, etc. Again, you're seeing some elasticities in the -0.1, -0.2 up to -0.5 range. So people say, when they see, even if you say, okay, I'll acknowledge there's some jobless from wages, but people earn more, it's still a good policy.
One of my co authors got an argument with Michael Reich and he's like, look, there's other things we do to help poor people, but none of that's gonna happen these days. So this is our best tool, well, if earnings are falling, it's not your best tool, it's a pretty bad tool.
So let me stop there because we're out of time.