

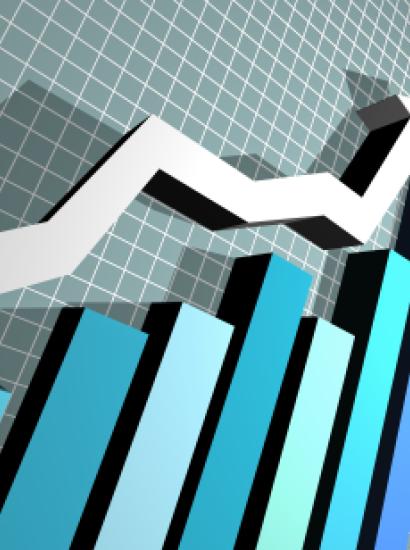

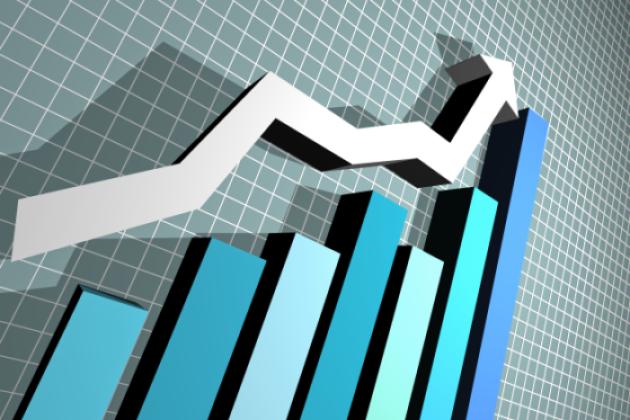
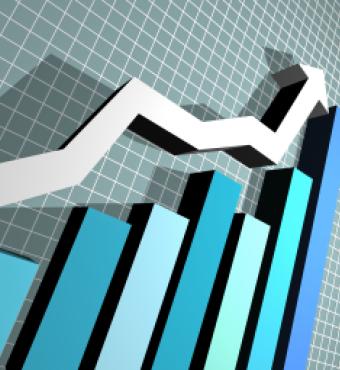
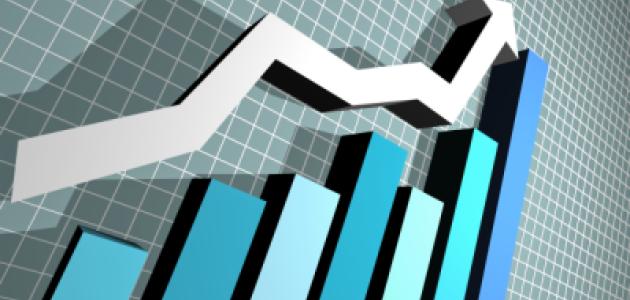

With the recent report that the Consumer Price Index (CPI) rose by 4.2 percent in the twelve-month period from April 2020 to April 2021, many people have started to worry that worse is to come. Many have used the feared C-word: Carter. Recall that during the Carter administration, in the forty-eight months between his inauguration on January 20, 1977, and Ronald Reagan’s inauguration on January 20, 1981, inflation measured by the CPI averaged 10.4 percent annually. There are lags, of course: Carter can hardly be blamed for the first few months of inflation in 1977, just as Reagan can hardly be blamed for the first few months of inflation in 1981. Still, the 10.4 percent estimate gives a reasonable take on Carter-era inflation. Running the numbers from June 1977 to June 1981 gives a similar average annual inflation rate: 10.5 percent.
Is the fear of Carter-era inflation justified? Is the increase in gasoline prices a sign of higher inflation? Is the fear of hyperinflation justified? With President Biden implementing and proposing various policies that will hurt economic growth, is there much danger in the short run of a return to stagflation? My answers: somewhat, no, no, and no.
Inflation is Always and Everywhere a Monetary Phenomenon
“Inflation is always and everywhere a monetary phenomenon.” Monetary economist Milton Friedman made this line famous after stating it in a talk he gave in India in 1963. In a trivial sense, of course, the statement is true. Inflation, by definition, means that money loses its purchasing power and, therefore, is a monetary phenomenon. But Friedman meant much more. After having defined inflation, in that same talk, as a “steady and sustained rise in prices,” Friedman argued that one could not find inflation anywhere in the world that was not caused by a prior increase in the supply of money or in the growth rate of the supply of money. His statement was an empirical one, not a logically necessary one, and most professional economists, still in the thrall of John Maynard Keynes, did not agree with Friedman. But within a decade, the evidence from the United States and other countries had convinced most economists that Friedman was right.
The reason has to do with what is called variously the quantity equation or the equation of exchange: MV = Py. In that equation, M is the supply of money, V is the velocity of money (which is inversely related to the demand for money), P is the price level, typically measured by the CPI, and y is real gross domestic product. Incidentally, Milton Friedman had a version of that equation on his California license plate.
If V and y are constant, then any increase in M must cause an increase in P. More typically, of course, V and y are changing but in somewhat predictable ways. A simple algebraic proof shows that the percentage change in M plus the percentage change in V must approximately equal the percentage change in P plus the percentage change in y. So, for example, if real GDP is growing at 3 percent per year and V is growing at 1 percent per year, then a 4 percent annual growth in the money supply will lead to an inflation rate of 2 percent. (4 + 1 = 2 + 3.)
A Return to Carter-era Inflation?
Will we return to Carter-era inflation? “Prediction is difficult, especially about the future” is a line that has been attributed to Danish atomic physicist Niels Bohr and baseball legend Yogi Berra. Prediction is difficult, but I’ll give it my best.
I would put an 80 percent probability on the prediction that before the end of 2022, there will be at least one twelve-month period in which the CPI has risen by at least 5 percent. I would also estimate less than a 20 percent probability that in the same time period, there will be a twelve-month period in which the inflation rate hits Carter-era 10 percent.
Here’s why I think inflation will rise. Go back to the equation of exchange and look at some recent data. Between December 16, 2019, just before we were aware of the Covid-19 pandemic, to February 1, 2021, M2, a broad measure of the money supply, grew by 26.7 percent. If that’s all you looked at, you would guess that the inflation rate should have been above Carter-era levels. But between the fourth quarter of 2019 and the first quarter of 2021, roughly the same time period (the two measures are computed over different units of time), M2 velocity dropped by 21 percent. Between the fourth quarter of 2019 and the first quarter of 2021, real GDP fell by 0.9 percent. Put all those together and you get approximately a low single-digit inflation rate.
Why did velocity fall so much? Because many millions of us hoarded money rather than spending it, since there were fewer things to spend it on: travel, large-audience events, bars, and eating out, to name four. One reason there were fewer things to spend it on is that tens of millions of us reacted cautiously, especially in the first few months, to the Covid threat. Another reason is that governments in most states made it illegal to spend on the above-listed items.
But now as lockdowns end and people get vaccinated, both reasons for reducing our spending are disappearing. The odds are very high that we will reduce our hoarding and increase money’s velocity. The Federal Reserve Board officials are aware of this. They’re not dummies. But people in those positions often have what economist Friedrich Hayek called a “fatal conceit”: they think they can manage things better than they can.
What happens if the Fed doesn’t do a good job and doesn't reduce M2 enough to make high inflation less likely? Then we could easily get inflation of 5 or 6 percent.
One factor putting pressure on the Fed is President Biden’s spending and budget deficit policies. By spending more, the federal government will need to issue more bonds. If the public buys them, that makes the Fed’s job less difficult. But if the Fed is pressured to buy more Treasury bonds, look out.
Are Higher Gasoline Prices a Sign of Higher Inflation?
One factor that seems to cause baby boomers to hark back to the Carter administration is high gasoline prices. When people think of Carter-era inflation, they often connect it to those high prices and the high world price of oil starting in 1973 and increasing, with fits and starts, through the 1970s. But one increased price does not inflation make. We can’t tell anything about inflation by looking at specific prices.
It is true that when a country such as the United States is a net importer of oil, an increase in the price of oil will, all else equal, cause our real GDP to be lower than otherwise. Go back to the equation of exchange discussed earlier. With slightly lower real GDP than otherwise, the price level, and therefore inflation, is higher than otherwise. But today the United States is only a small net importer of oil and as recently as late 2019 was a slight net exporter. So an increase in the price oil simply helps domestic producers to about the same extent that it hurts domestic consumers. The net effect on real US GDP is close to zero.
There’s one caveat to the above. Any government policy that causes waste makes real GDP lower than otherwise and, therefore, causes the price level to be somewhat higher than otherwise. The wasteful policy that is one of the factors in the recent increase in gasoline prices is the federal government’s policy on ethanol, which began during the George W. Bush administration. Although I can’t go into a detailed explanation here, the federal government’s requirement that refiners use ethanol in gasoline adds 30 cents to the price per gallon. Not all of that 30 cents was added recently. But the recently increased price of waivers that allow refiners to avoid using car-destroying ethanol has accounted for some of the recent increase in gasoline prices.
Should We Fear Hyperinflation?
Some observers have suggested that we should fear hyperinflation. They have no idea what hyperinflation is. Hyperinflation is not just high inflation. Hyperinflation is inflation of 50 percent per month or more. The most extreme hyperinflations in history were in Germany from 1921 to 1923, Hungary from August 1945 to July 1946, and Zimbabwe from March 2007 to November 2008. We’re not even close to 1 percent per month, let alone 50 percent per month. The United States did have extremely high inflation during the Revolutionary War—have you ever heard the expression “not worth a Continental”?—and in the Confederacy during the Civil War. Other than that, the highest US inflation rate in our history was in 1918, when the government used the newly created Federal Reserve to fund its participation in World War I. Even then, the price level between April 1917, when America entered the war, and November 1918, when the war ended, increased by 27 percent. That’s 16.3 percent on an annual basis. Bad? Yes. But hyperinflation? Still not close.
Is There Much Danger of “Stagflation” in the Short Run?
Many baby boomers worry that we’ll have “stagflation,” which is a combination of high inflation and low, zero, or negative economic growth. The odds of that happening in the next year are under 1 in 100.
Why am I so confident? Because we are set to have very high growth in real GDP this year. The reason is not that President Biden’s economic policies are so good. They’re actually pretty bad. The $300 federal addition to the weekly unemployment benefit, which was part of his $1.9 trillion bill in March, will actually cause real GDP to grow more slowly than otherwise because it discourages millions of lower-wage people from taking jobs. My criticism is not partisan. I criticized a similar, though worse, plan after President Trump, back in March 2020, signed the CARES Act, which added a whopping $600 per week to weekly unemployment benefits. That’s the nice thing about economics: we can talk about effects of policies without knowing whether the initiator of the bad policies has an R or a D after his name.
Still, even with this growth-destroying policy, with possibly more to come, real GDP will rise a lot this year. To see why, imagine a hose hooked to a water spigot with the spigot turned on but an elephant standing on the hose. Not much water comes out the other end. But if the elephant gets off the hose, then, even if the water spigot is turned down slightly, a lot of water will come out the other end.
Governments are that elephant. The federal government, to some extent, but mainly the majority of state governments are standing with various weights on that hose by enforcing lockdowns. Once they get off, real GDP will increase.
My prediction: we will have at least 4 percent inflation during the next twelve months and real GDP growth of at least 5 percent on an annualized basis. If the feds get off the hose in September by not renewing the $300 per month federal addition to unemployment benefits, we will have even higher growth.
So no, we will not have stagflation.