


Introduction
The twenty-first century will be the century of intelligent machines. Artificial intelligence (AI) has begun to transform the economy as it as enables machines to do more and more of the cognitive tasks that were once done only by humans. In the coming decade, many existing tasks will be replaced by machines, while new ones will emerge. Almost every job will be affected in some way and most will need to be redesigned. Businesses will rise and fall depending on how well they understand, foster and harness the changing skills that are needed to be productive. Economies will thrive if they can create and update the institutions needed to create these skills.
In particular, the branch of AI known as machine learning (ML) has advanced significantly in just the past decade, largely reflecting improvements in the area of deep learning, a technique that trains large neural networks on large datasets (Brynjolfsson and Mitchell 2017). Three different types of advances, each of about two orders-of-magnitude, have combined to make this possible: 1) an increase in the quantity and quality of digital data, 2) improvements in computational power, reflecting not only the march of Moore’s Law, but also new specialized architectures like GPUs and TPUs, and 3) improved algorithms (McAfee and Brynjolfsson 2017). As a result, the performance of ML algorithms has improved significantly. In a highly cited example, the image recognition algorithms on the ImageNet Dataset improved from barely 70% in 2010 to over 97% today, and now surpass human level performance on the same data. Voice recognition and natural language processing, machine translation, recommendation systems, gaming and many other tasks have also seen striking improvements (Shoham et al. 2018). Because capabilities like vision, speech and decision-making are so fundamental for most occupations, these improvements to technology suggest that substantial changes in the nature of work can be expected.
Despite these impressive advances, however, ML is far from being capable of doing the full range of human cognitive tasks. This raises some obvious questions. What tasks can ML do well, and what tasks are best done by humans? What are the implications for jobs, industries and different geographies? How can we quantify the changing value of human skills for businesses? In this paper, we seek to address these questions by drawing on several streams of research that have been underway for several years. First, we report on work based on interviews with a set of leading experts in machine learning to develop a set of criteria, or a rubric, for distinguishing which tasks are most suitable for machine learning (Brynjolfsson and Mitchell 2017; Brynjolfsson, Mitchell, and Rock 2019). In turn, we applied this rubric to score 18,112 tasks in 950 occupations spanning most of the U.S. economy to create a guide to how different occupations, industries and regions would likely be affected as the use of ML becomes more pervasive (Brynjolfsson, Mitchell, and Rock 2019). Second, to illustrate how different types of human capital, including skills and education, affect firm value, we draw on ongoing work using data from LinkedIn, Compustat, and other sources to newly quantify these relationships.
Our first set of findings are that while existing ML technologies are not able to automate all the tasks that comprise any of the occupations we study, they are sufficiently advanced to do at least some tasks in almost every job. This suggests substantial redesign of work and significant reskilling will be needed to harness the potential of ML. Our findings suggest that people in lower wage jobs will be disproportionately affected as will those in retailing and transportation industries. People in smaller cities are also more likely to be affected than larger ones.
Investments into the redesign of work can yield significant value for firms. In a second set of findings, drawing on data from LinkedIn, we find that skills and education have value not only to the employees who acquire them, but also to the owners of the companies where those employees work. In fact, the value of IT-related investments has grown dramatically in recent years and, based on a sample of publicly traded firms, as of the end of 2016 amounts to about 39% of the value of installed property, plant, and equipment (about $8-9 billion in ITIC per firm in the sample). This implies that firms have a large incentive to invest in creating and updating the skill sets needed to take advantage of emerging IT—most recently, ML—as these technologies become increasingly pervasive. Although many skills will be affected, the skills needed to implement ML are a notable special case: their value has grown markedly as new technologies like Tensorflow have boosted their economic impact (Rock 2019a). The magnitude and scope of the reskilling and business process redesign needed to put ML breakthroughs into practice means that it will require years if not decades before the full effects are felt, just as with earlier technological breakthroughs. (Brynjolfsson, Rock, and Syverson 2018).
The Labor Market’s Exposure to Machine Learning Technology
We apply a task-level approach to understanding the effects of ML. This is the most natural unit of analysis for specific capabilities. Detailed information about task-level exposure to ML can then be aggregated to improve our understanding of its effects on many aspects of the economy, including occupations, firms, industries, and regions. In particular, occupations can be considered useful bundles of tasks assigned to similar types of workers. The task-level approach relates worker labor inputs to new types of technological capital within a production function (Autor, Levy, and Murnane 2003; Acemoglu and Autor 2011). Inherent in the managerial decision to replace human tasks with capital services is a trade-off between wages paid to workers and capital rental costs for the machines that could do the same tasks. Increasing machine capabilities or decreasing capital costs for a given task increases incentives to substitute capital for labor in this class of models.
While they are typically stable in the short-run, the set of tasks within each occupation changes over time, as does the nature of many of the tasks themselves. New tasks are created and the value of old tasks changes, altering what the most productive mixture of tasks for a given occupation might be. A related class of models (Acemoglu and Restrepo 2018) elucidates the trade-off between investment in automation technologies and investment in creating new tasks. In these models, increased automation increases the returns to innovative activity in creating new tasks for human labor. In nearly all cases though, the impact of new technology on labor demand is contingent on more than simple human labor task replacement potential.
Making predictions about the impact of ML on labor demand is challenging because any given occupation most often performs a wide variety of tasks. Inevitably, some of those tasks are more suitable for machine learning than others. Focusing on what ML can do with respect to the tasks currently done by workers, however, can yield insight into which tasks are most exposed to technology. Brynjolfsson and Mitchell (2017), Brynjolfsson, Mitchell, and Rock (2018, 2019), and (Brynjolfsson et al. 2019) build, refine and extend a rubric that seeks to identify the tasks in the economy which have the greatest Suitability for Machine Learning (SML). The rubric consists of 23 evaluative questions with potential answers ranging from 1 (very low SML) to 5 (very high SML). The rubric is used to create a score for 2,059 detailed work activities from the U.S. government’s O*NET database. In turn, these scores were aggregated into 950 occupations consisting of 18,112 tasks which share detailed work activities across occupations. After being validated by experts in machine learning and assessed by a team at MIT on a representative set of tasks, rubric evaluation was scaled up to the full set of tasks by respondents on CrowdFlower, as described in Brynjolfsson, Mitchell, and Rock (2018). Subsequent iterations in Brynjolfsson, Mitchell, and Rock (2019) and Brynjolfsson et al. (2019) use data from Amazon Mechanical Turk respondents with some further refinements and improved quality control. The questions are designed such that a “1” (Strongly Disagree) corresponds to low SML and a “5” (Strongly Agree) corresponds to high SML, and neutral exposure corresponds to a score of 3 (Neither Agree nor Disagree). In most of the analyses, the values for each of these individual scores are essentially averaged to get an overall task-weighted occupation-level SML score.1
Exposure to ML does not necessarily mean that the human labor will be replaced or even reduced in that occupation. As discussed in Brynjolfsson and Mitchell (2017), in addition to substitution, ML can also be used in at least five other ways: to complement labor, to increase demand for it by lowering costs, to change demand by changing overall income, to change information flows and thus information asymmetries, or to drive a reorganization of work. While there has been much emphasis on the first of these possibilities (automation and thus substitution) research suggest that the biggest effect in the coming years will be in driving a redesign of work, as only some tasks in most occupations are suitable for machine learning, while others will continue to require human labor.
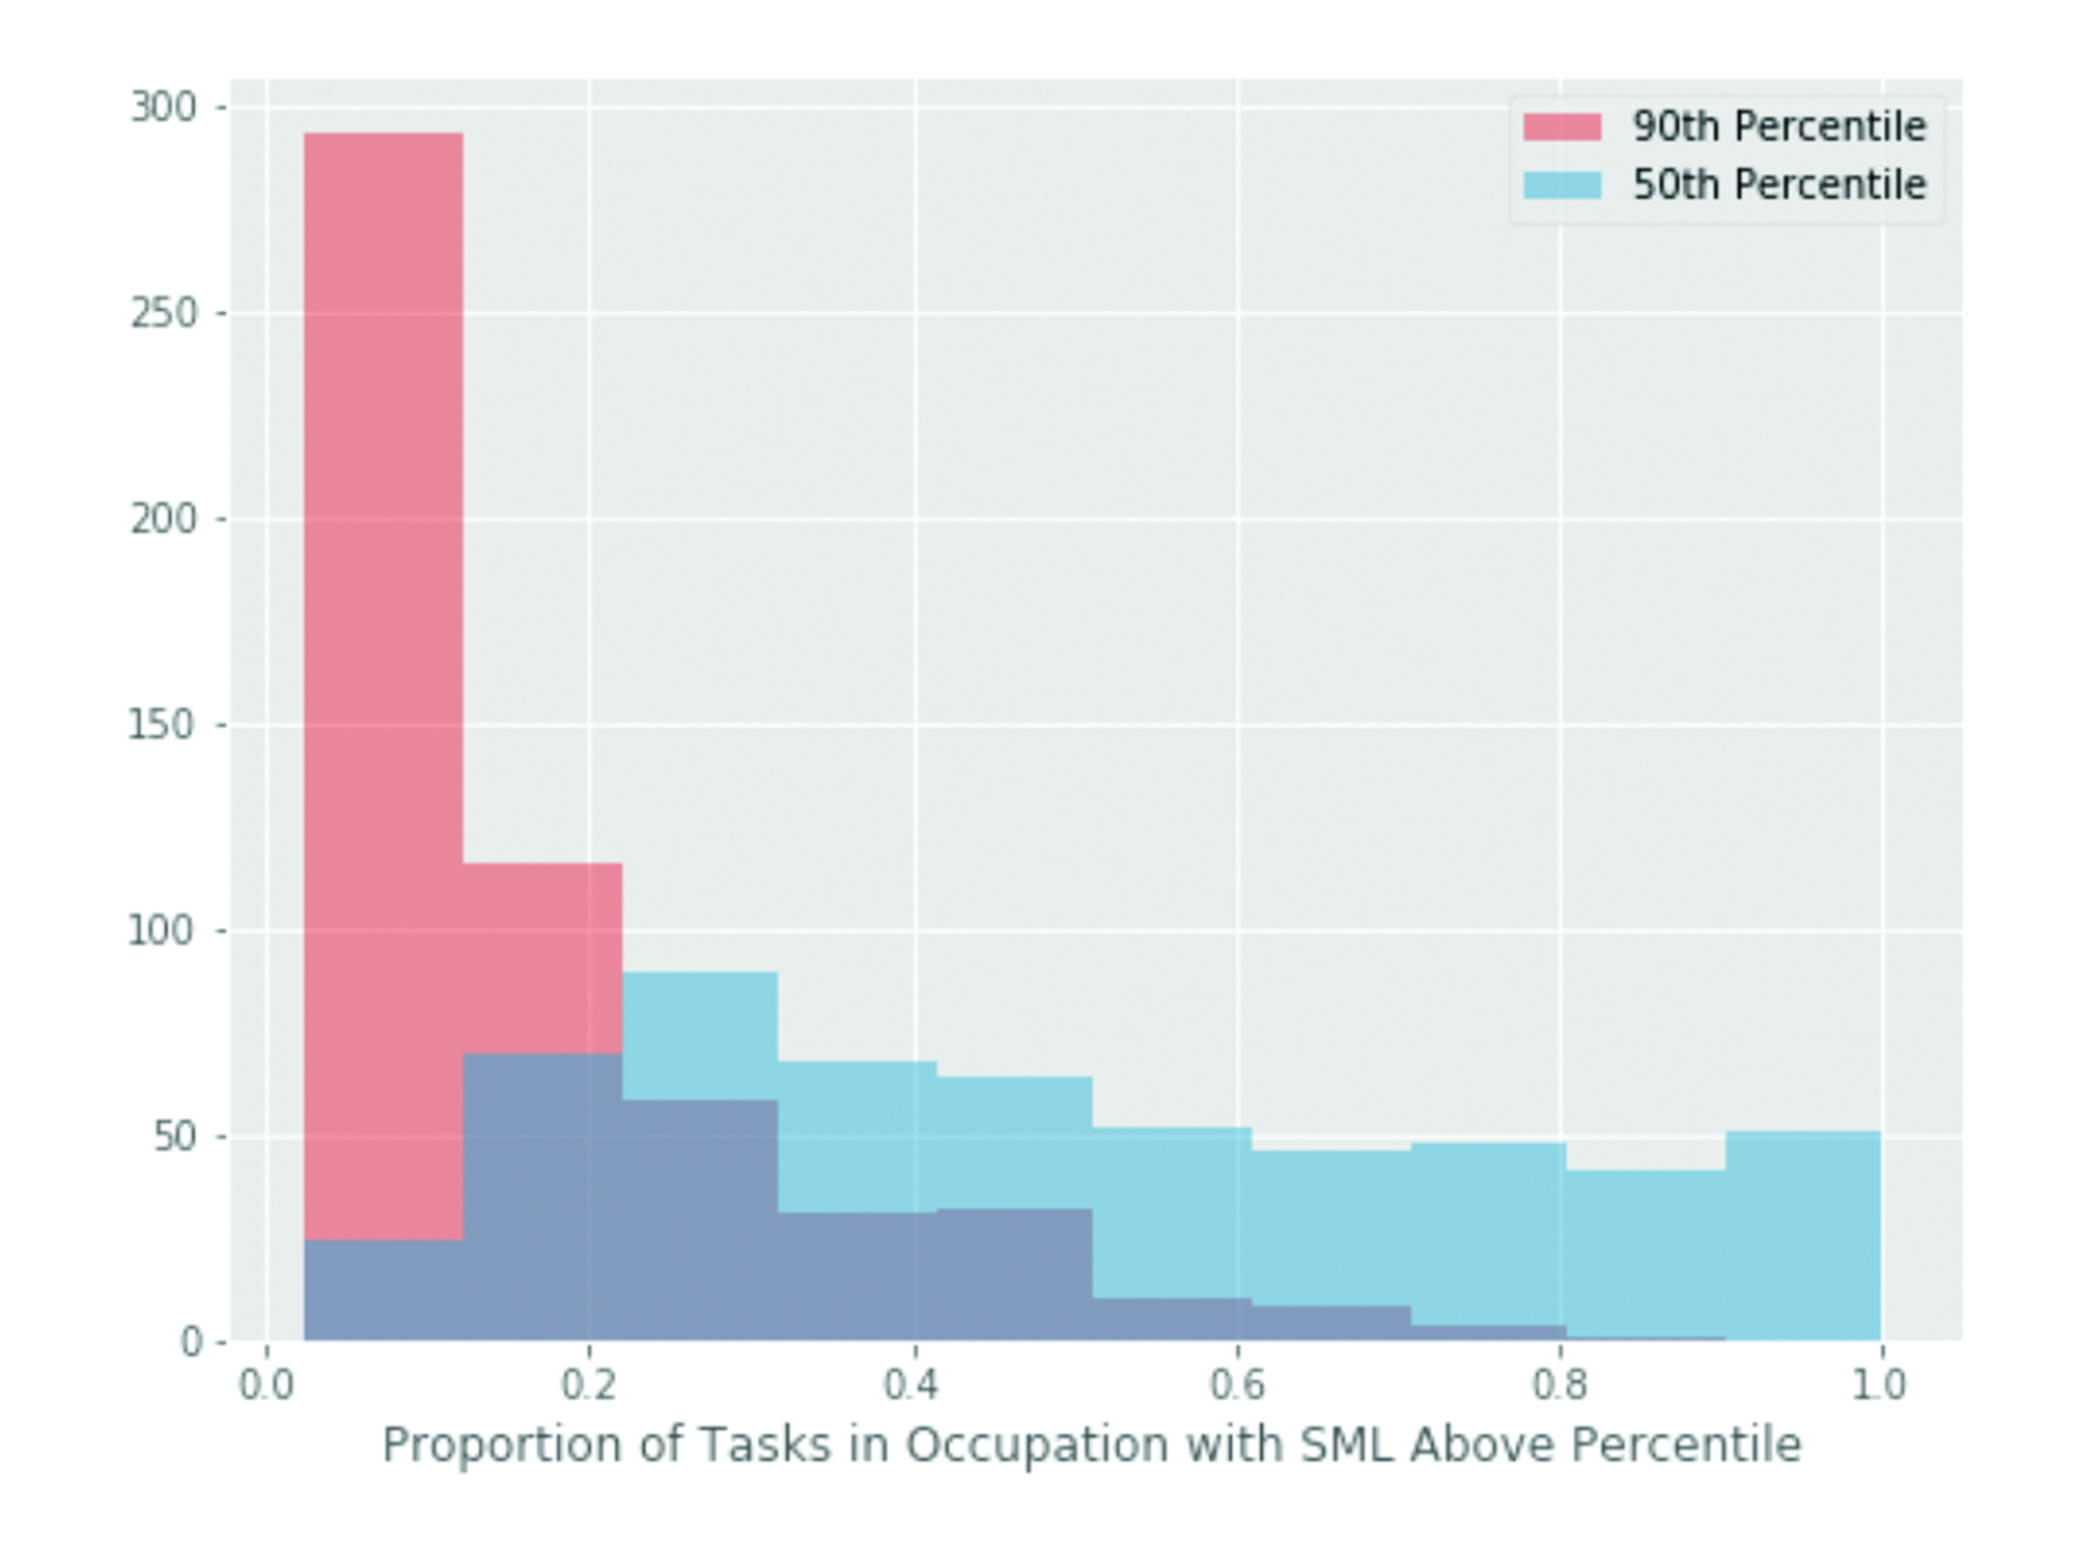
Occupations vary considerably in their exposure to machine learning as measured by SML score. Figure 1 below shows the distribution of SML across jobs, tasks, and activities. Very few, if any, occupations are completely exposed to ML. The maximum SML value of any task is a 4.0, with a minimum of 2.13 across all tasks. Strikingly, nearly all occupations have at least one task with a relatively high SML score. Figure 2 shows the count of occupations (vertical axis) against their proportions of task SML above the 90th and 50th percentile of SML (horizontal axis). No occupation has tasks entirely in the 90th (or higher) SML percentile, but most occupations have at least some tasks above this threshold, and almost all jobs have some number of tasks above the 50% threshold.
If ML could do all tasks in a particular occupation, there would be little need or opportunity to re-organize the tasks in that job. It would be fully automated. Likewise if there were nothing ML could do in that occupation, there would be no reason to re-organize the occupation to unlock the gains from ML technology. The fact that most occupations fall between these extremes underscores the likelihood that machine learning will drive re-organization and re-engineering of how tasks are bundled and assigned into occupations. Indeed, Brynjolfsson et al. (2019), highlight that re-organization of work, not automation or substitution, is the labor demand force with the greatest economic potential for ML (see Figure 1 and 2).2, 3
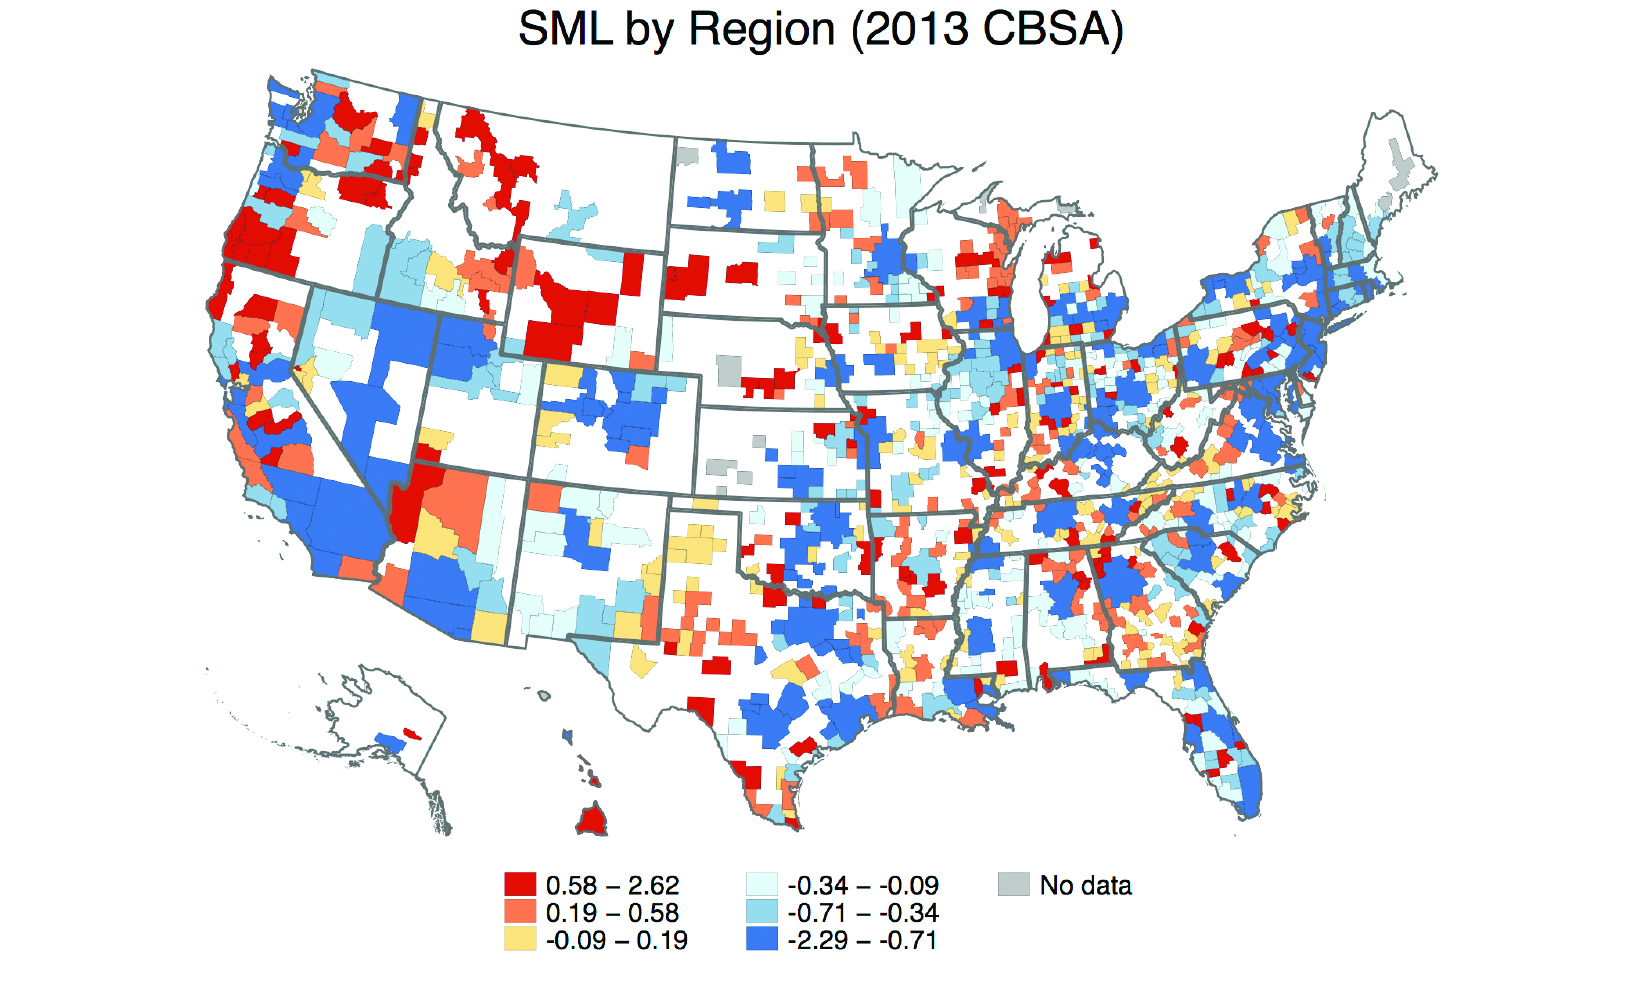
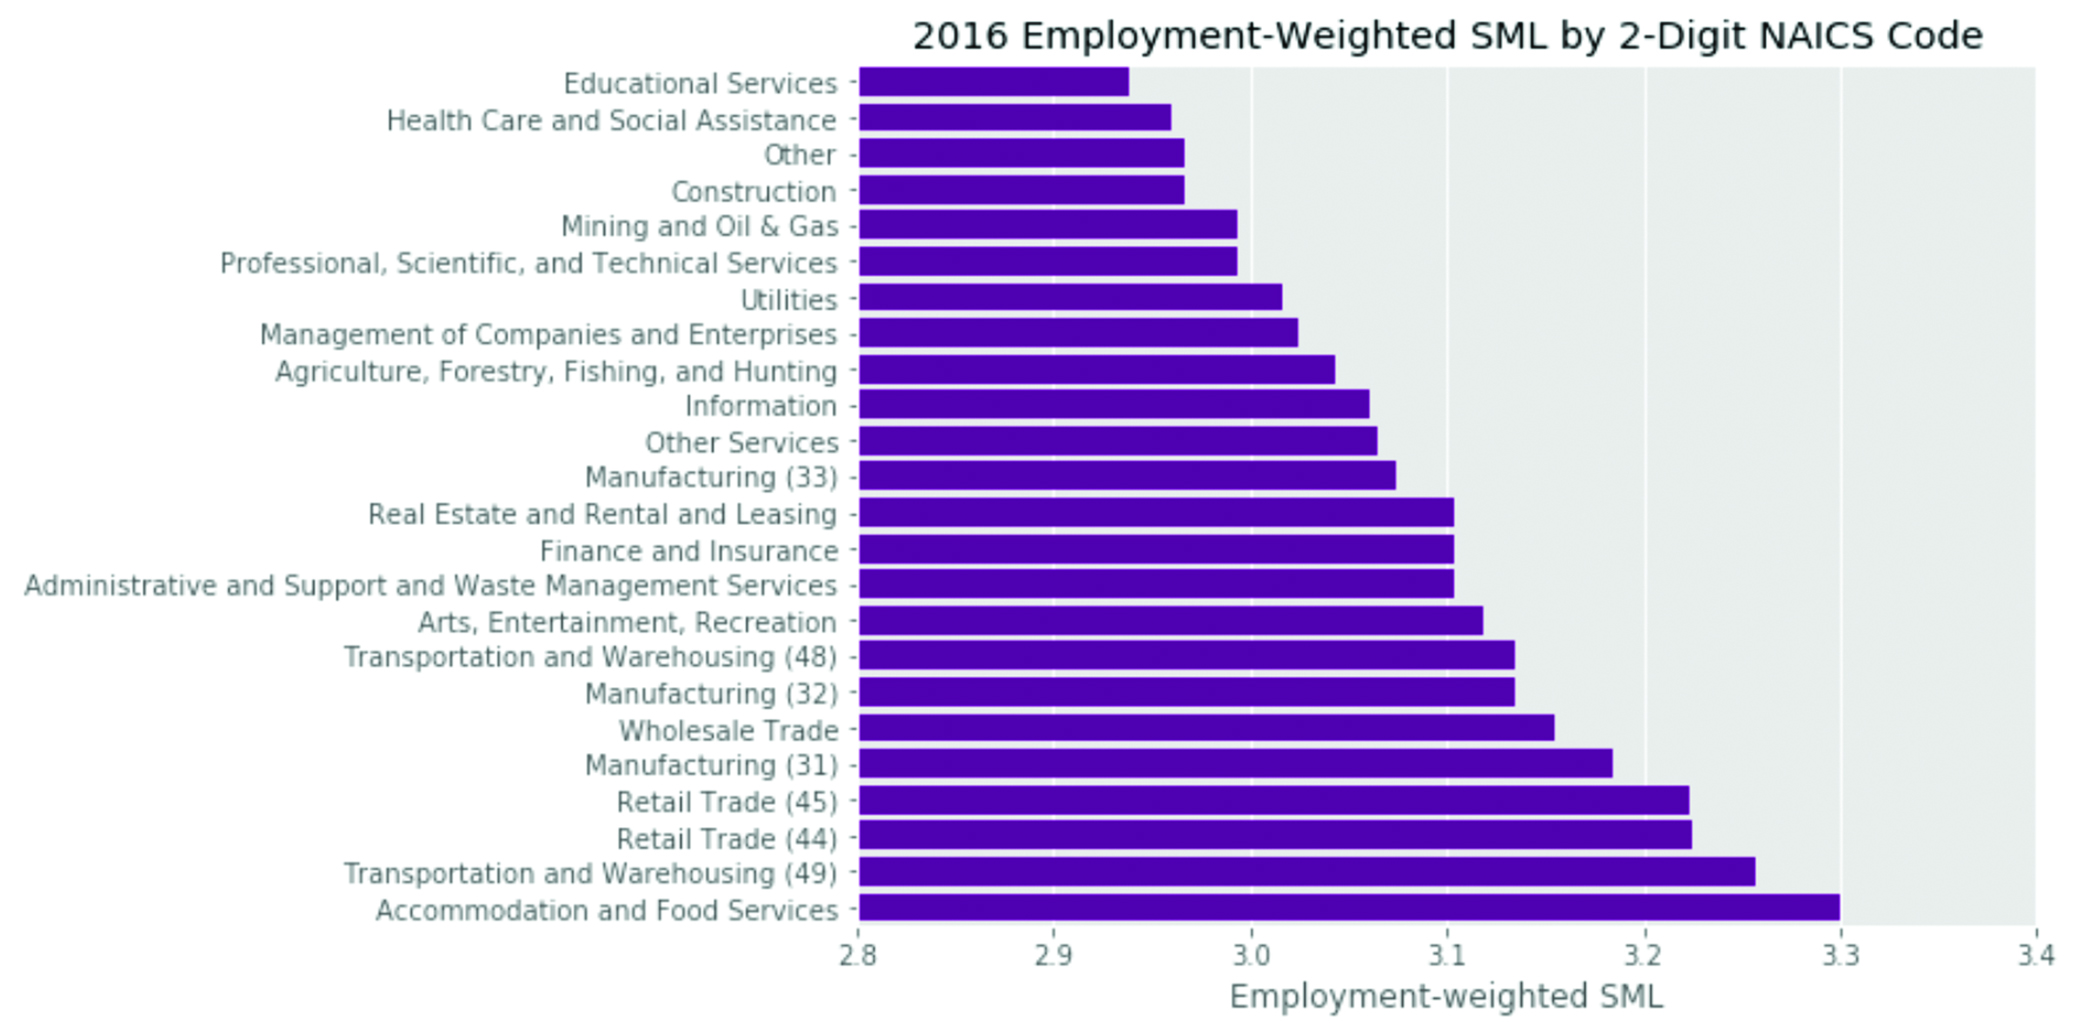
The occupational impact of ML will be shared across many different types of labor, but it will also be uneven. Some occupations, and therefore industries and regions as well, are more exposed to ML than others. Figure 3 shows that lower wage occupations have relatively higher SML scores, though all wages levels have some occupations at either end of the SML spectrum.4 Figures 4A and 4B shows the standardized SML scores and Image Data scores (respectively) aggregated by occupation type to the region level. Large cities tend to have lower relative overall SML scores. In contrast, much of the potential for using ML for image analysis value is more concentrated in large cities. Finally, Figure 5 shows that employment-weighted SML by industry. Accommodation and Food Services, Transportation and Warehousing, and Retail Trade are relatively more exposed to the re-organization impact of ML than Education and Health Care (see Figures 3-5).5, 6, 7
Higher SML tasks are often clerical tasks like balancing accounts or medical transcription or the type of routine work that might be done in a factory (e.g. inspecting items for defects). Most occupations have some component task that does something clerical. But taking advantage of this new technology will require adjustments to how these tasks are performed together. That means changing occupations, but also business processes.
Firms and organizations will have to build new kinds of intangible capital to complement the new types of technological capital created by machine learning advances. At the same time, know-how and tacit knowledge built for the old economic environment will lose value (Greenwood and Yorukoglu 1997). In this way, the coming changes from ML technologies are similar to many earlier varieties of information technology. Part of what is happening now is an extension of the recent past, which has been characterized by waves of investment in networked computing, databases, and other information technologies.
IT, Intangible Capital, and Value
The business process reengineering needed to unlock value from emerging technologies, such as ML technologies, can comprise a growing category of a firm’s assets (R. E. Hall 2001; Brynjolfsson and Hitt 2000; Bresnahan, Brynjolfsson, and Hitt 2002). This “IT-related intangible capital” (“ITIC”) is the result of investments that firms make into becoming information processing organizations, including investments in business process reengineering that facilitate rapid information acquisition, employee learning, and decision-making. These types of assets are likely to play an increasingly important role in explaining economic outcomes such as growth and firm performance. In some ways, these investments are similar to those that firms make in physical capital such as trucks or manufacturing equipment. Just as units of physical capital enable the conversion of raw materials to goods, units of ITIC enable firms to convert information and ideas into products and services.
The biggest difference is that the measurement of these IT-based intangible assets has proven elusive. Investment into this form of capital is largely invisible (to researchers) and depreciation rates are idiosyncratic and variable, so conventional methods for measuring capital stocks cannot be easily applied (B. H. Hall 1993). For other types of assets, one might use market transactions, such as a lease or resale price, to derive prices, but there are no observable markets for trading stand-alone ITIC—firms cannot sell their management practices or learning cultures.
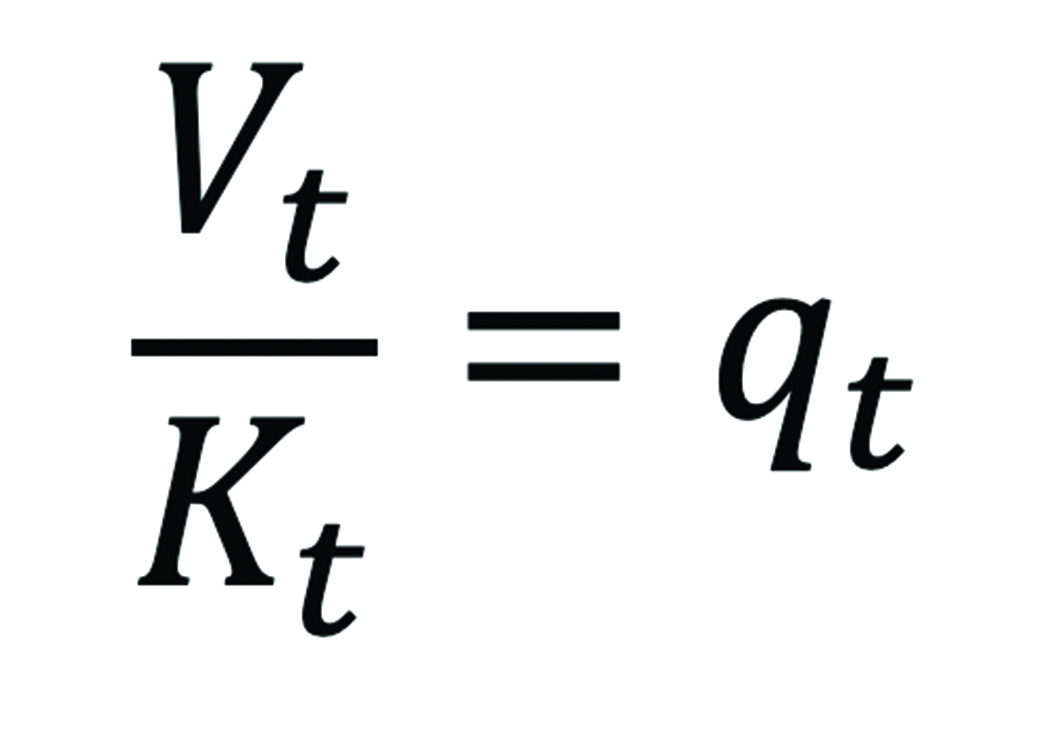
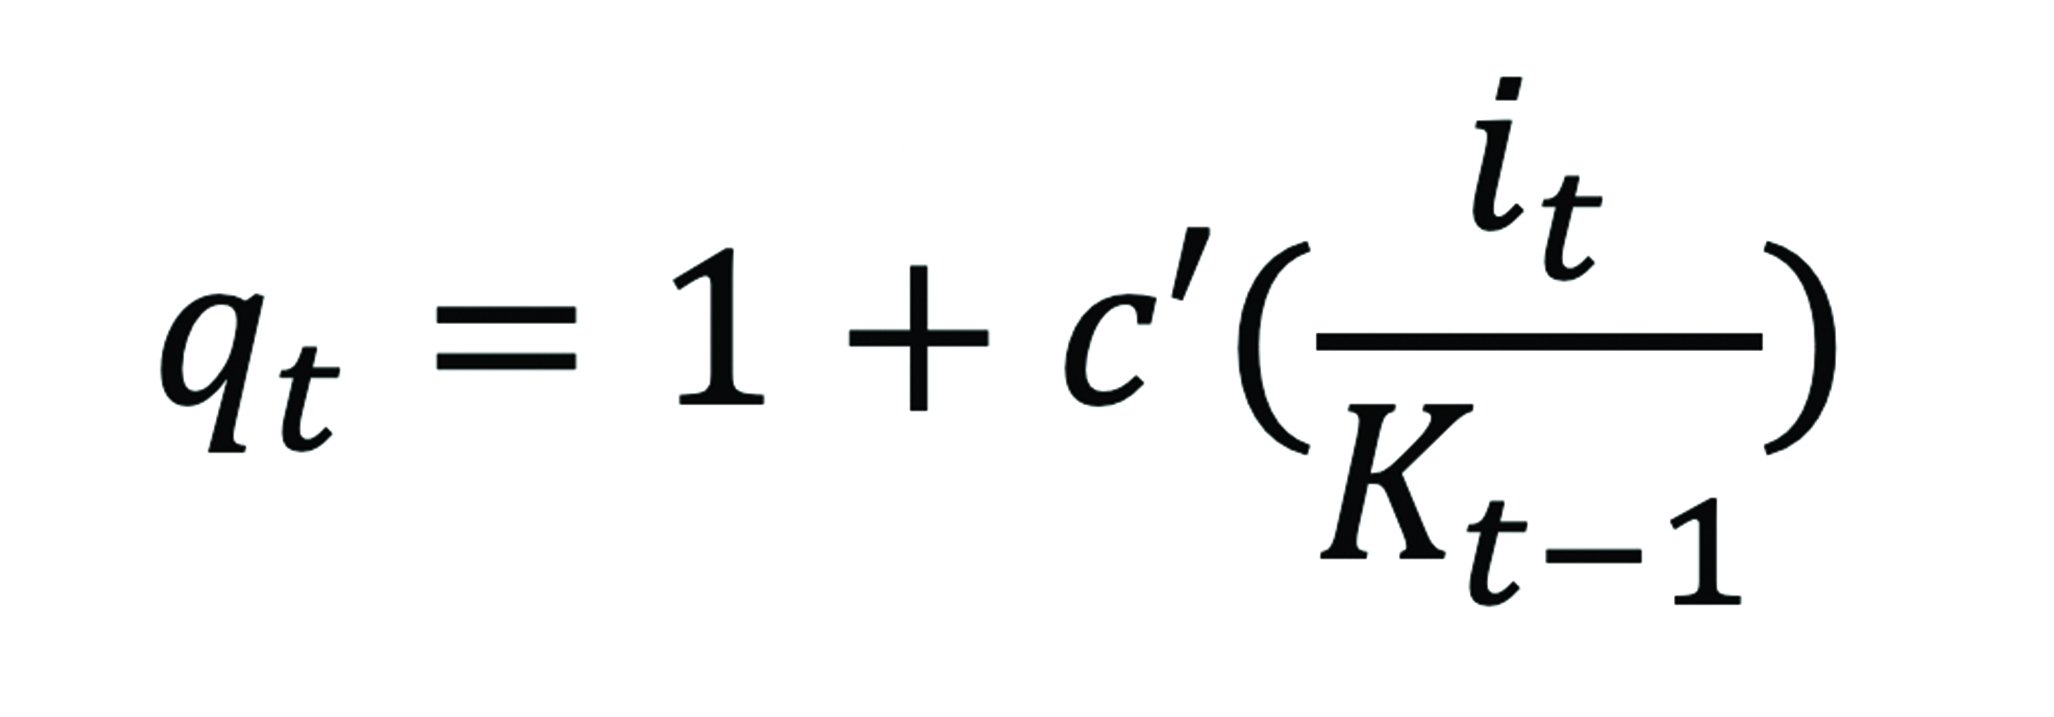
As an alternative approach to measuring these assets, we can use methods from the literature on intangible assets to derive changes in the prices and quantities of ITIC in U.S. firms. This literature argues that the quantities of a firm’s intangible assets can be inferred from the value of its securities (R. E. Hall 2001). The intuition behind this approach is that under reasonable conditions, the value of a firm’s securities is equivalent to the value of its capital assets, which is in turn equal to the price of installed capital times its quantity, or equivalently, the ratio of market value to installed capital is equal to its price (equation 1).
Because firms’ investments in these assets are governed by an adjustment cost condition (equation 2), from the marginal adjustment cost function8 evaluated at the investment rate at time t:
Thus, we have two equations with two unknowns which can be solved to recover quantities of tangible or intangible capital. In other words, even when investment into capital cannot directly be observed, its quantities can be computed using changes in the value of a firm’s assets. In the case of IT, the value of a firm’s ITIC is not recorded, but these ITIC values can be inferred using proxy measures of investment into a correlated input, such as IT infrastructure (Brynjolfsson, Hitt, and Yang 2002). We use the method described above to derive quantities of ITIC.
A challenge with this approach is that a lengthy series of firm-level IT investment data are needed, and such data have historically been difficult to obtain at the firm-level. To address this problem, we generated an IT series of one of the most important inputs into the construction of ITIC—IT labor—to enable the application of the methods described above.
The data were obtained from LinkedIn, a leading online professional network web site upon which individuals post their employment histories, including information for each job they have held on employer, job title, and years spent at the firm. Employer data generally include name, size, and industry. We use the employment histories of the workers on LinkedIn who identify themselves as IT workers in order to measure the distribution of IT employment in large public firms over a period of approximately three decades.9
The length of this labor series is important for two reasons. First, it is consistently available through the period of the dot-com bust, after the crash, and through the last decade including capturing the rise in spending around big data, data science, and machine learning, so we can test how much of the value of IT-related intangibles in the late 1990’s was attributable to investor mispricing or when spending on this asset resumed. Second, in the absence of direct measures of spending on IT-related infrastructure, the wages paid to IT labor are among the principal inputs into the construction of ITIC. In other words, firms can build new information structures around old IT capital, so IT wages may be a more relevant input to ITIC investment than IT capital spending.
The key results from the application of these IT labor data to the model described earlier are shown in Figure 6 below. First, by 2016, the stock of IT-related intangible capital in our panel of firms10 had grown to about 25% of the value of physical capital stock. Despite swings in the value of ITIC around the dot-com boom and bust, firms continued to accumulate IT-related intangible capital well after the bust and through the 2008 recession (see Figure 6).
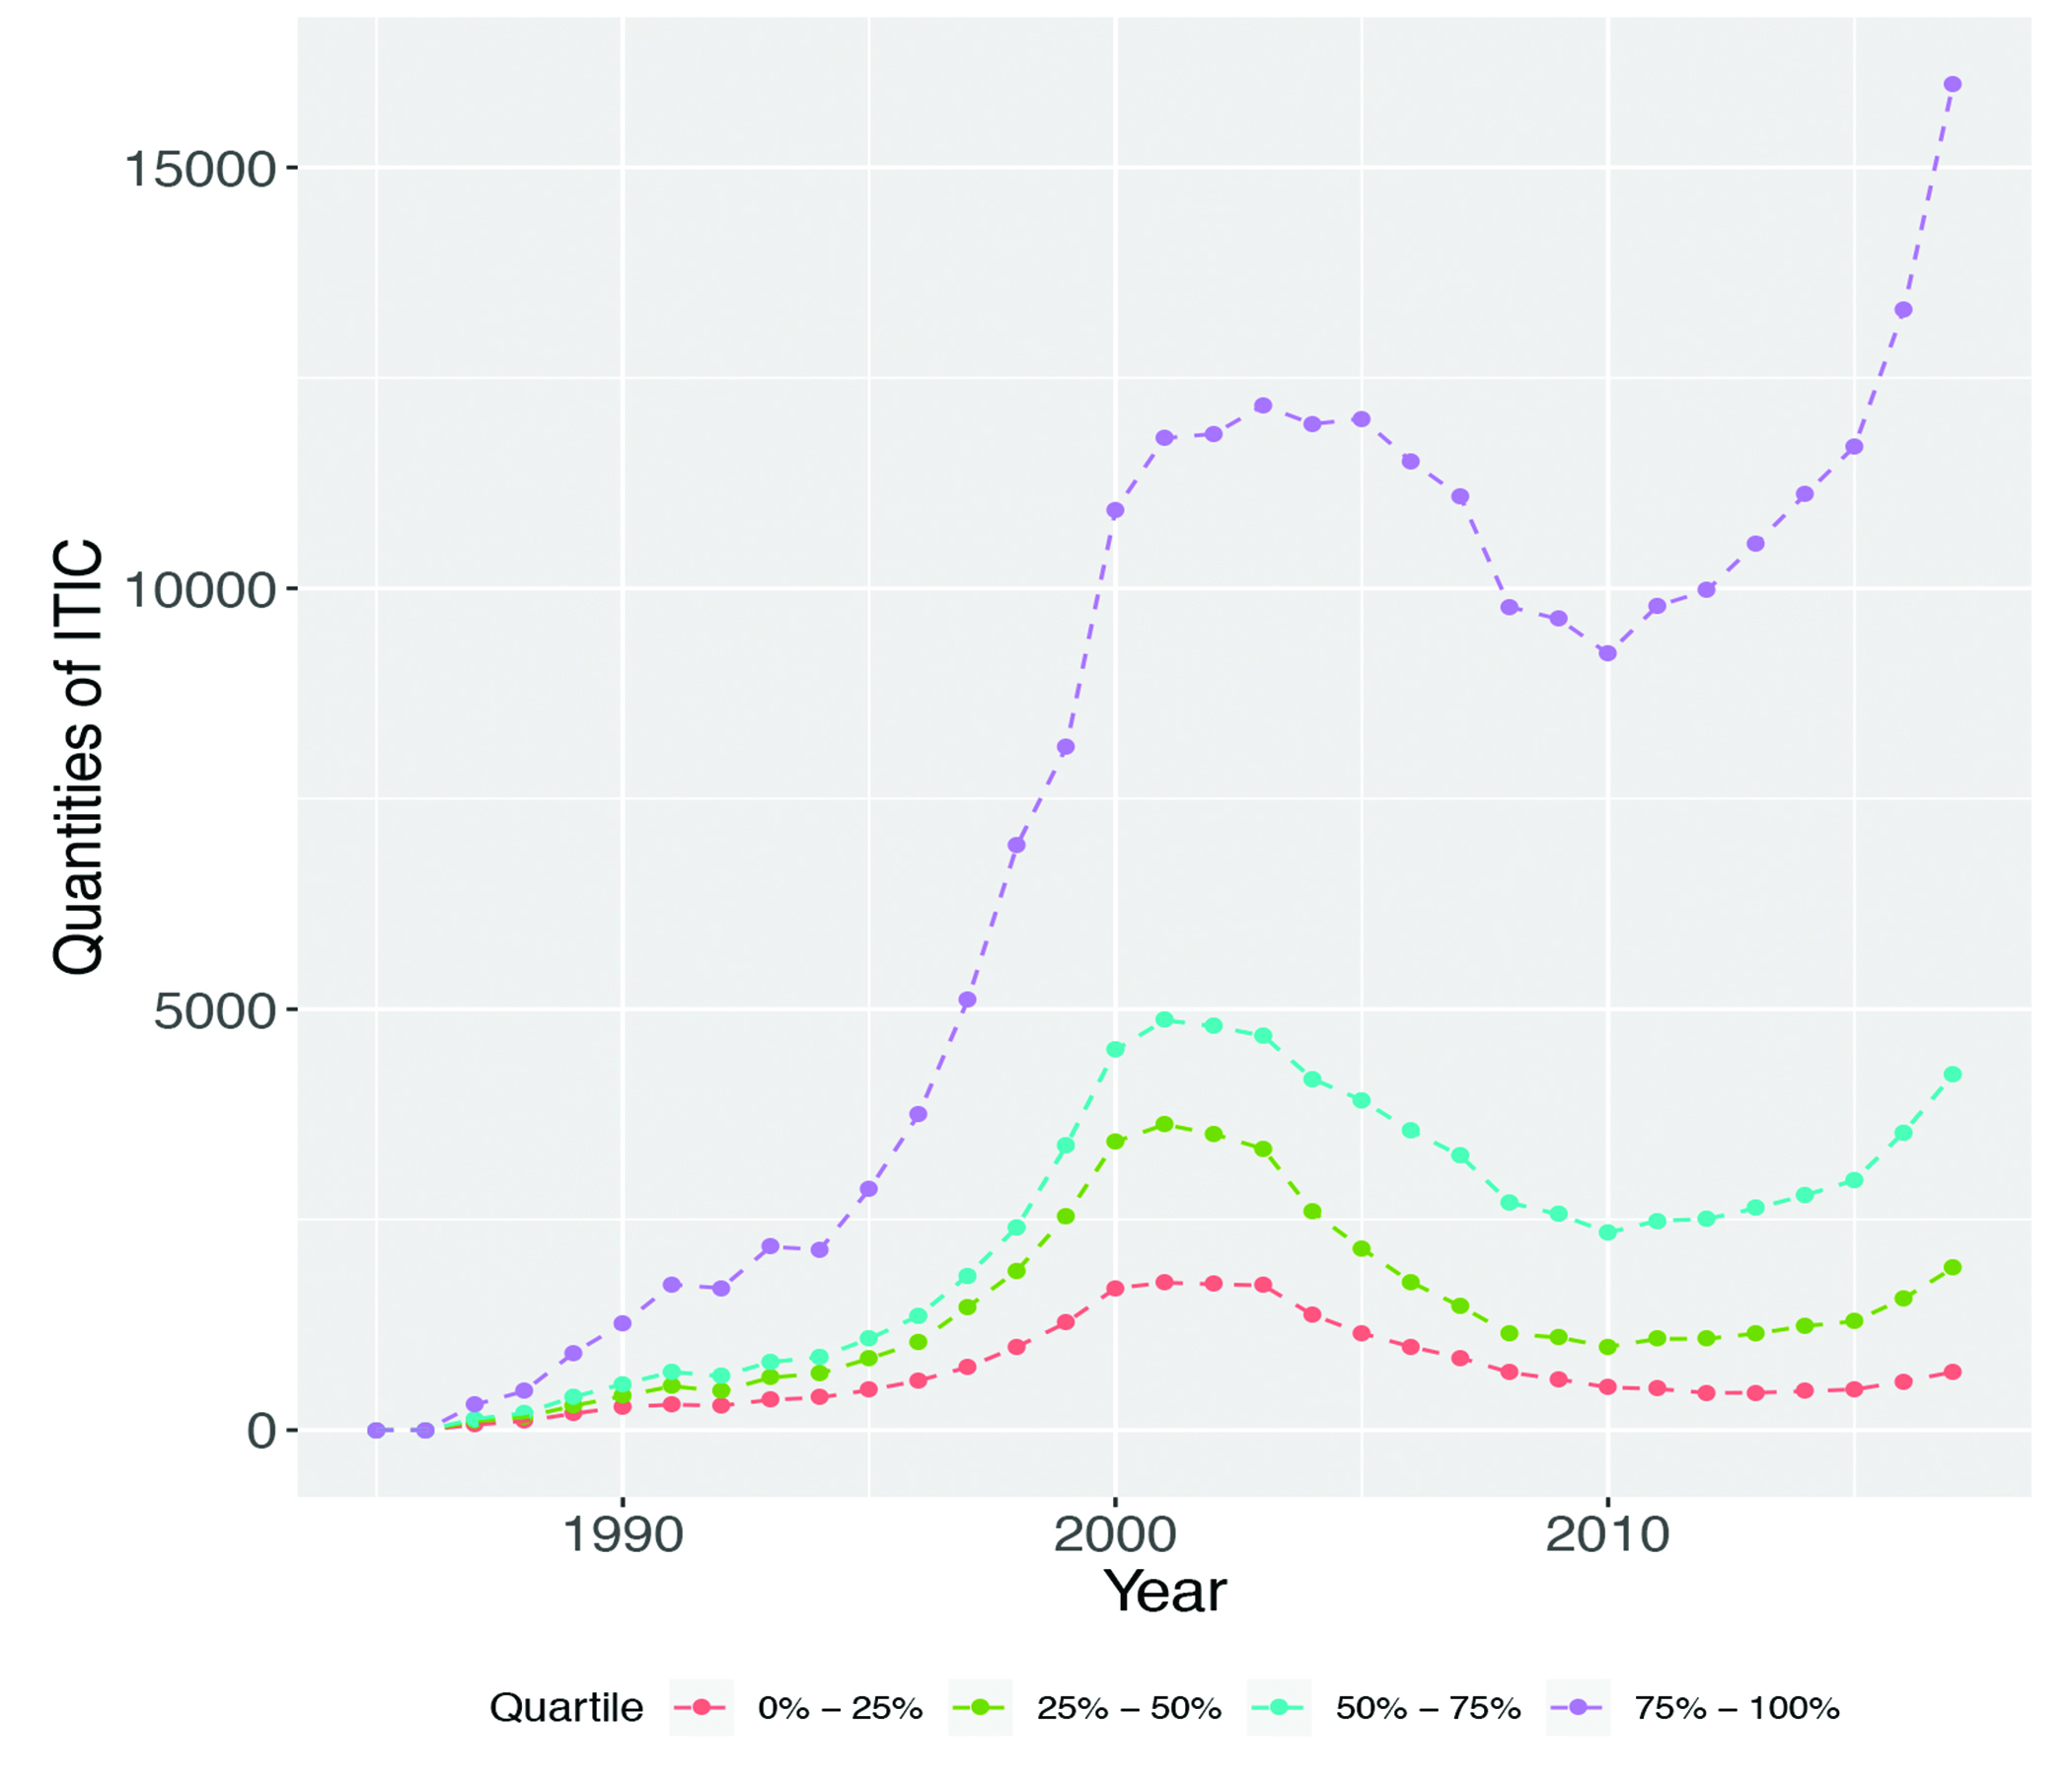
We also find evidence of significant heterogeneity in the distribution of these IT intangible assets within the U.S. economy. Figure 7 plots quantities of ITIC by quintile in terms of ITIC stock value. This figure indicates that growth in this form of capital, far from being evenly distributed, has been concentrated in a relatively small set of firms, which is consistent with other patterns of digitization and firm dominance that have been observed in the recent economic data. Higher quantities of ITIC for these firms suggests that they will enjoy significant production-based advantages in the future.
The Market Value of Skills Used for Implementing Machine Learning
What does our approach to assessing ITIC say about skills that can be used to implement machine learning? The types of intangible assets that firms build change over time to match the IT environment. Changes in technology alter the value of the installed capital base as well, including the value of human capital. Using the LinkedIn skills data, Rock (2019a) finds that Google’s open source launch of TensorFlow lifted the market value of AI-using publicly traded firms by 4 to 7%. TensorFlow is a software package that makes it easier for software engineers and data scientists to implement deep learning models. Similar to the way that coding in Python or C++ is easier than coding in assembly language, TensorFlow saves a lot of the effort required to build and train neural networks. Because of that, companies that had intangible capital related to AI increased in value when TensorFlow was launched. The complementary workers these firms needed to generate value from their intangible assets became more abundant. While impactful to the companies involved, this is one relatively small example of the overall rising tide in IT-related intangible assets. Realizing the returns to AI skill investments often demands extensive investment in other IT skills like cloud computing, data engineering, and specialized management. All of these skill varieties require complementary investments in IT-related intangible assets as well (Tambe 2014).
Implications of the growth of ITIC
Our findings suggest that investment in information structures and related skills produces relatively long-lived, durable assets. For policy makers, these findings suggest that the large waves of investment in IT-related intangibles are associated with the development of significant productive capacity and, all else being equal, that this should boost prospects for long-run growth. The fact that ITIC assets behave similarly to other capital assets in recent years is itself interesting. This may be because translating organizational innovations into productive capital requires significant investment in reengineering and skills.
There are, however, important differences between ITIC and physical capital. Unlike most types of physical capital, ITIC has diminished value outside the context of the firm. This has important implications for firm valuation and acquisition. Development researchers have traditionally looked at capital accumulation as an engine for growth. The lack of secondary markets for IT-related intangible assets ties these questions together in an important way to firm health. When firms are dismantled, ITIC is likely to disappear. Therefore, it is worth continuing to further our understanding how the rising importance of ITIC, in conjunction with notable differences between ITIC and physical assets, impacts economic behavior.
Conclusion
Since the industrial revolution, general purpose technologies like the steam engine and electricity have driven economic growth and higher living standards. We believe that the most important general purpose technology of our era is AI, especially ML. A key feature of general purpose technologies is that they enable complementary innovations and investments. Among the most important complements are new skills and new business processes. Unlike plant and equipment, skills and process innovations are intangible. This makes it difficult to measure and makes it subject to underinvestment and malinvestment. By using the SML framework, we can identify some of the tasks that are most likely to be affected by machine learning, as well as some of their associated skills.
The large increase in IT-related intangible capital in general, coupled with the surge in the value of skills needed for implementing ML in particular, suggest an important role for businesses reskilling the workforce. Our analysis shows that shareholders stand to benefit from when the employees of their firms have more of the right sets of skills. However, while the advances in technology have often been breathtaking, the reskilling of the workforce and the reinvention of business processes has lagged. This is reflected, for instance, in declining business dynamism according to work by Decker et al. (2016). The key bottleneck for unlocking value often is not technology but people. Therefore, for adapting to ML enabled work, the grand challenge of the 21st century will be speeding the adoption of new skills and organizational practices that support these technologies.
Erik Brynjolfsson is the director of MIT’s Initiative on the Digital Economy and professor of management science at the MIT Sloan School. Daniel Rock is a doctoral candidate at MIT Sloan, and Prasanna Tambe is an associate professor of operations, information, and decisions at the University of Pennsylvania’s Wharton School.
Supporting Data
Figure 1. Distribution of Counts of Suitability for Machine Learning (SML) Score for Occupations, Tasks, and Detailed Work Activities
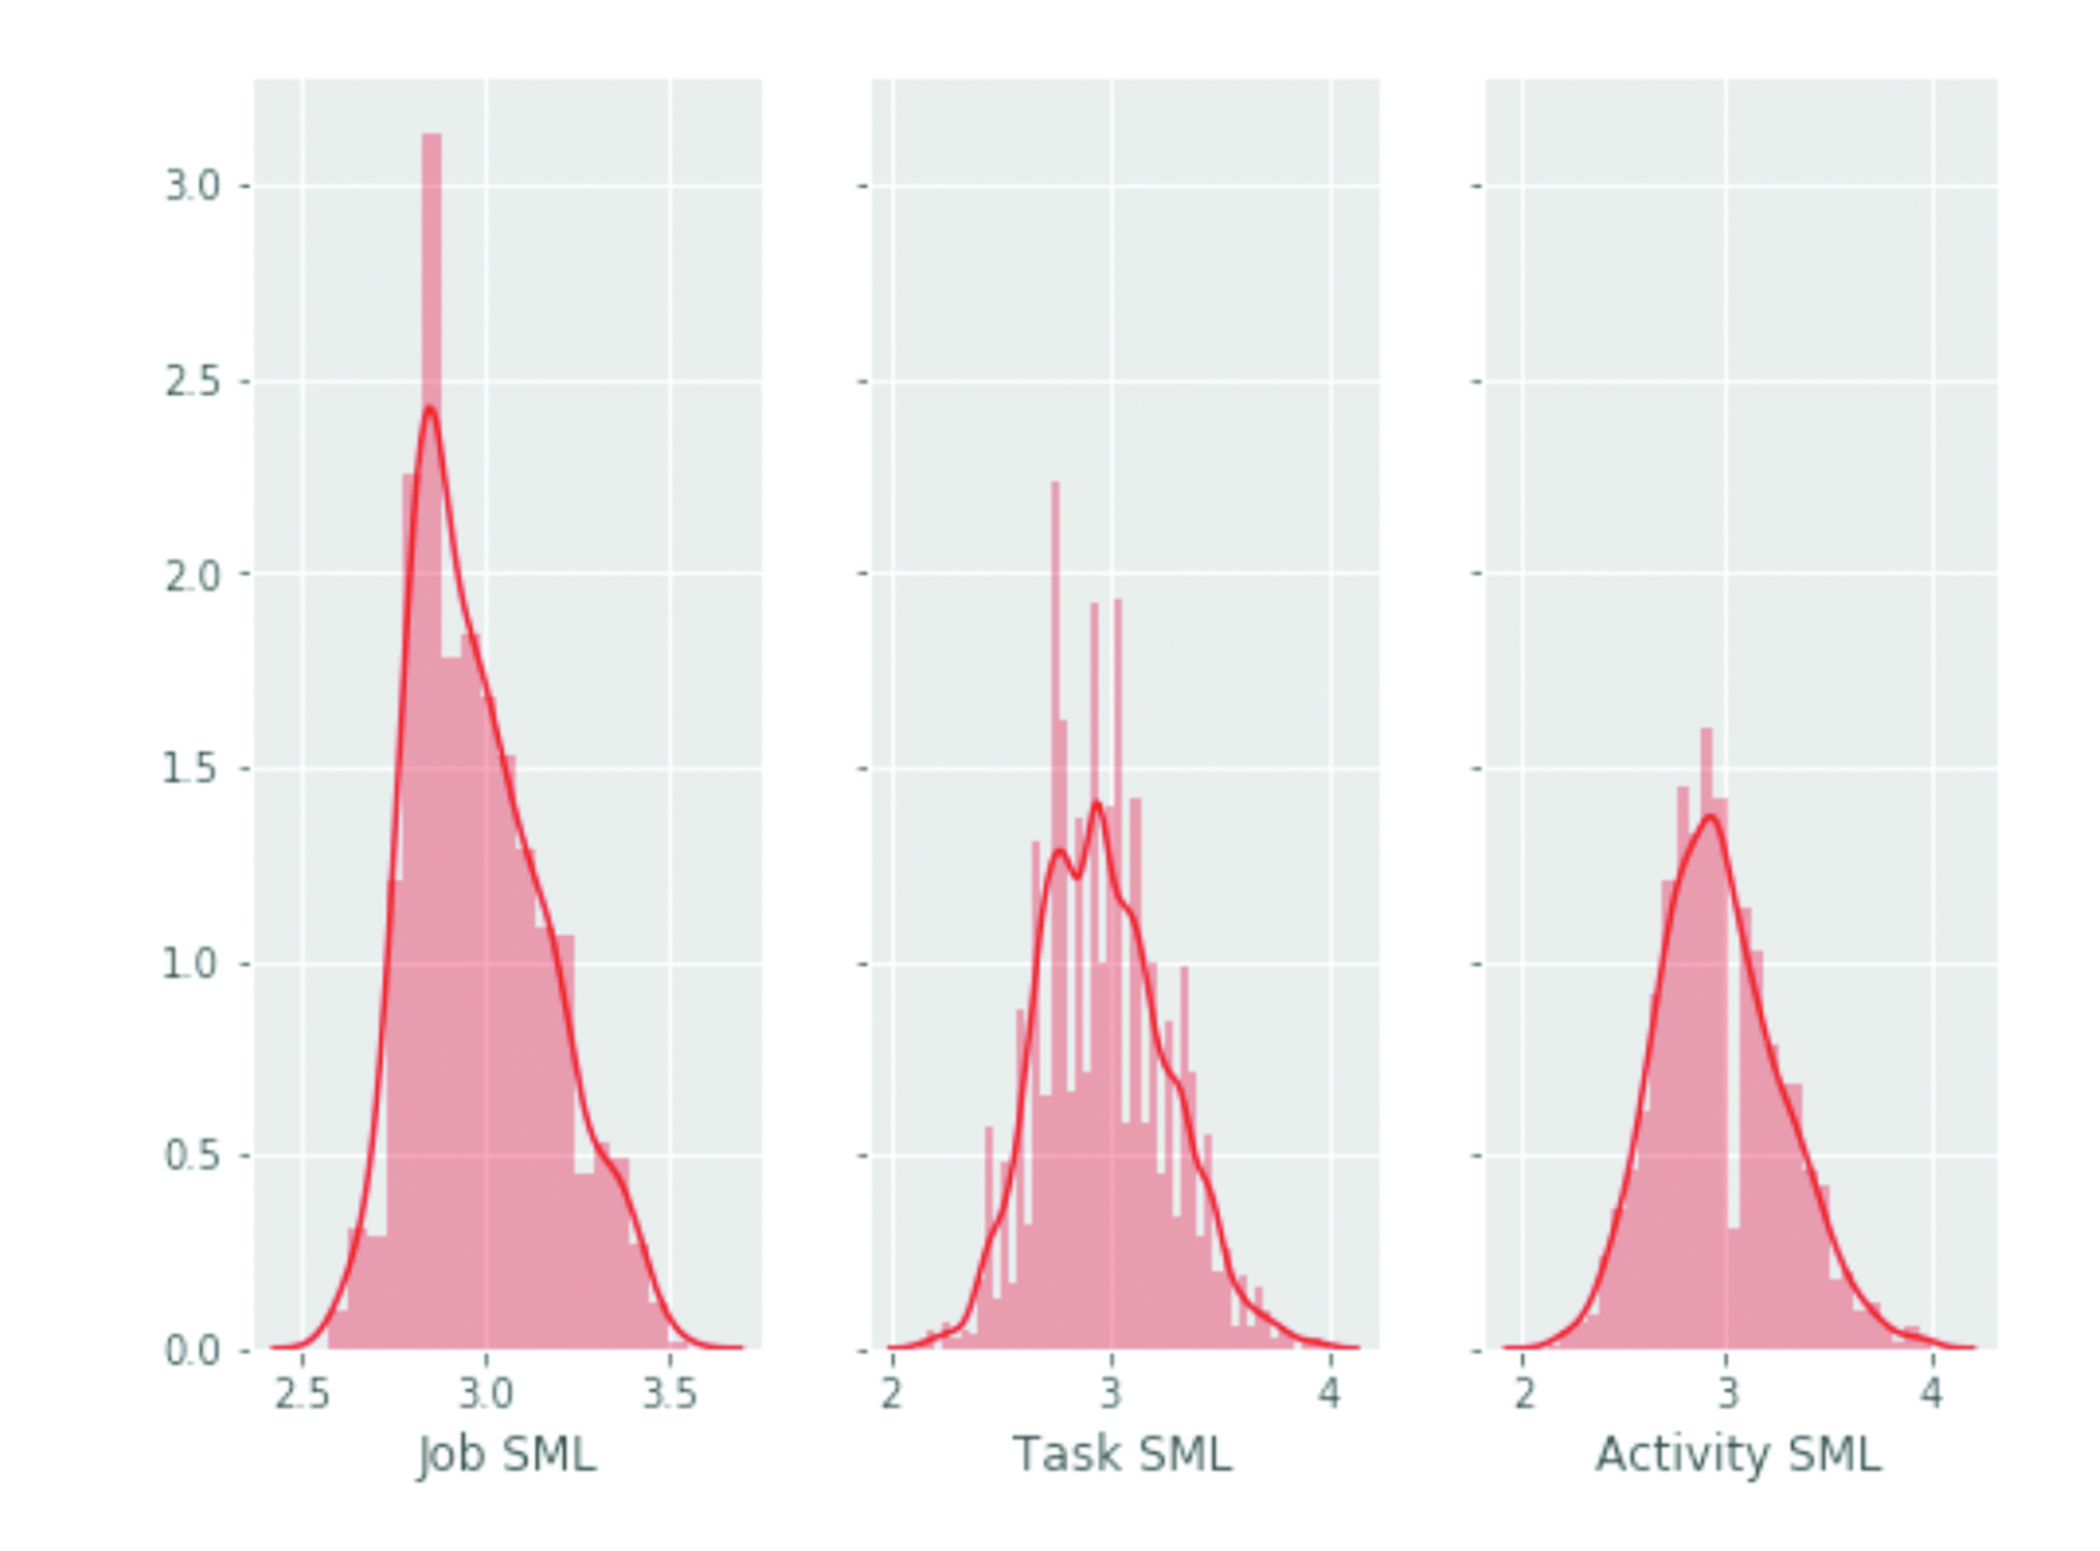
Figure 2. Histogram of Occupations by Proportion of Tasks with SML Larger than 90th and 50th Percentile Thresholds
Source for Figures 1 and 2: Brynjolfsson, Mitchell, and Rock (2018a); Rock (2019)
Figure 3. SML Score vs. 2016 Median Wage Percentile; Regression Coefficient: -0.0034 (t-stat = 18.5)
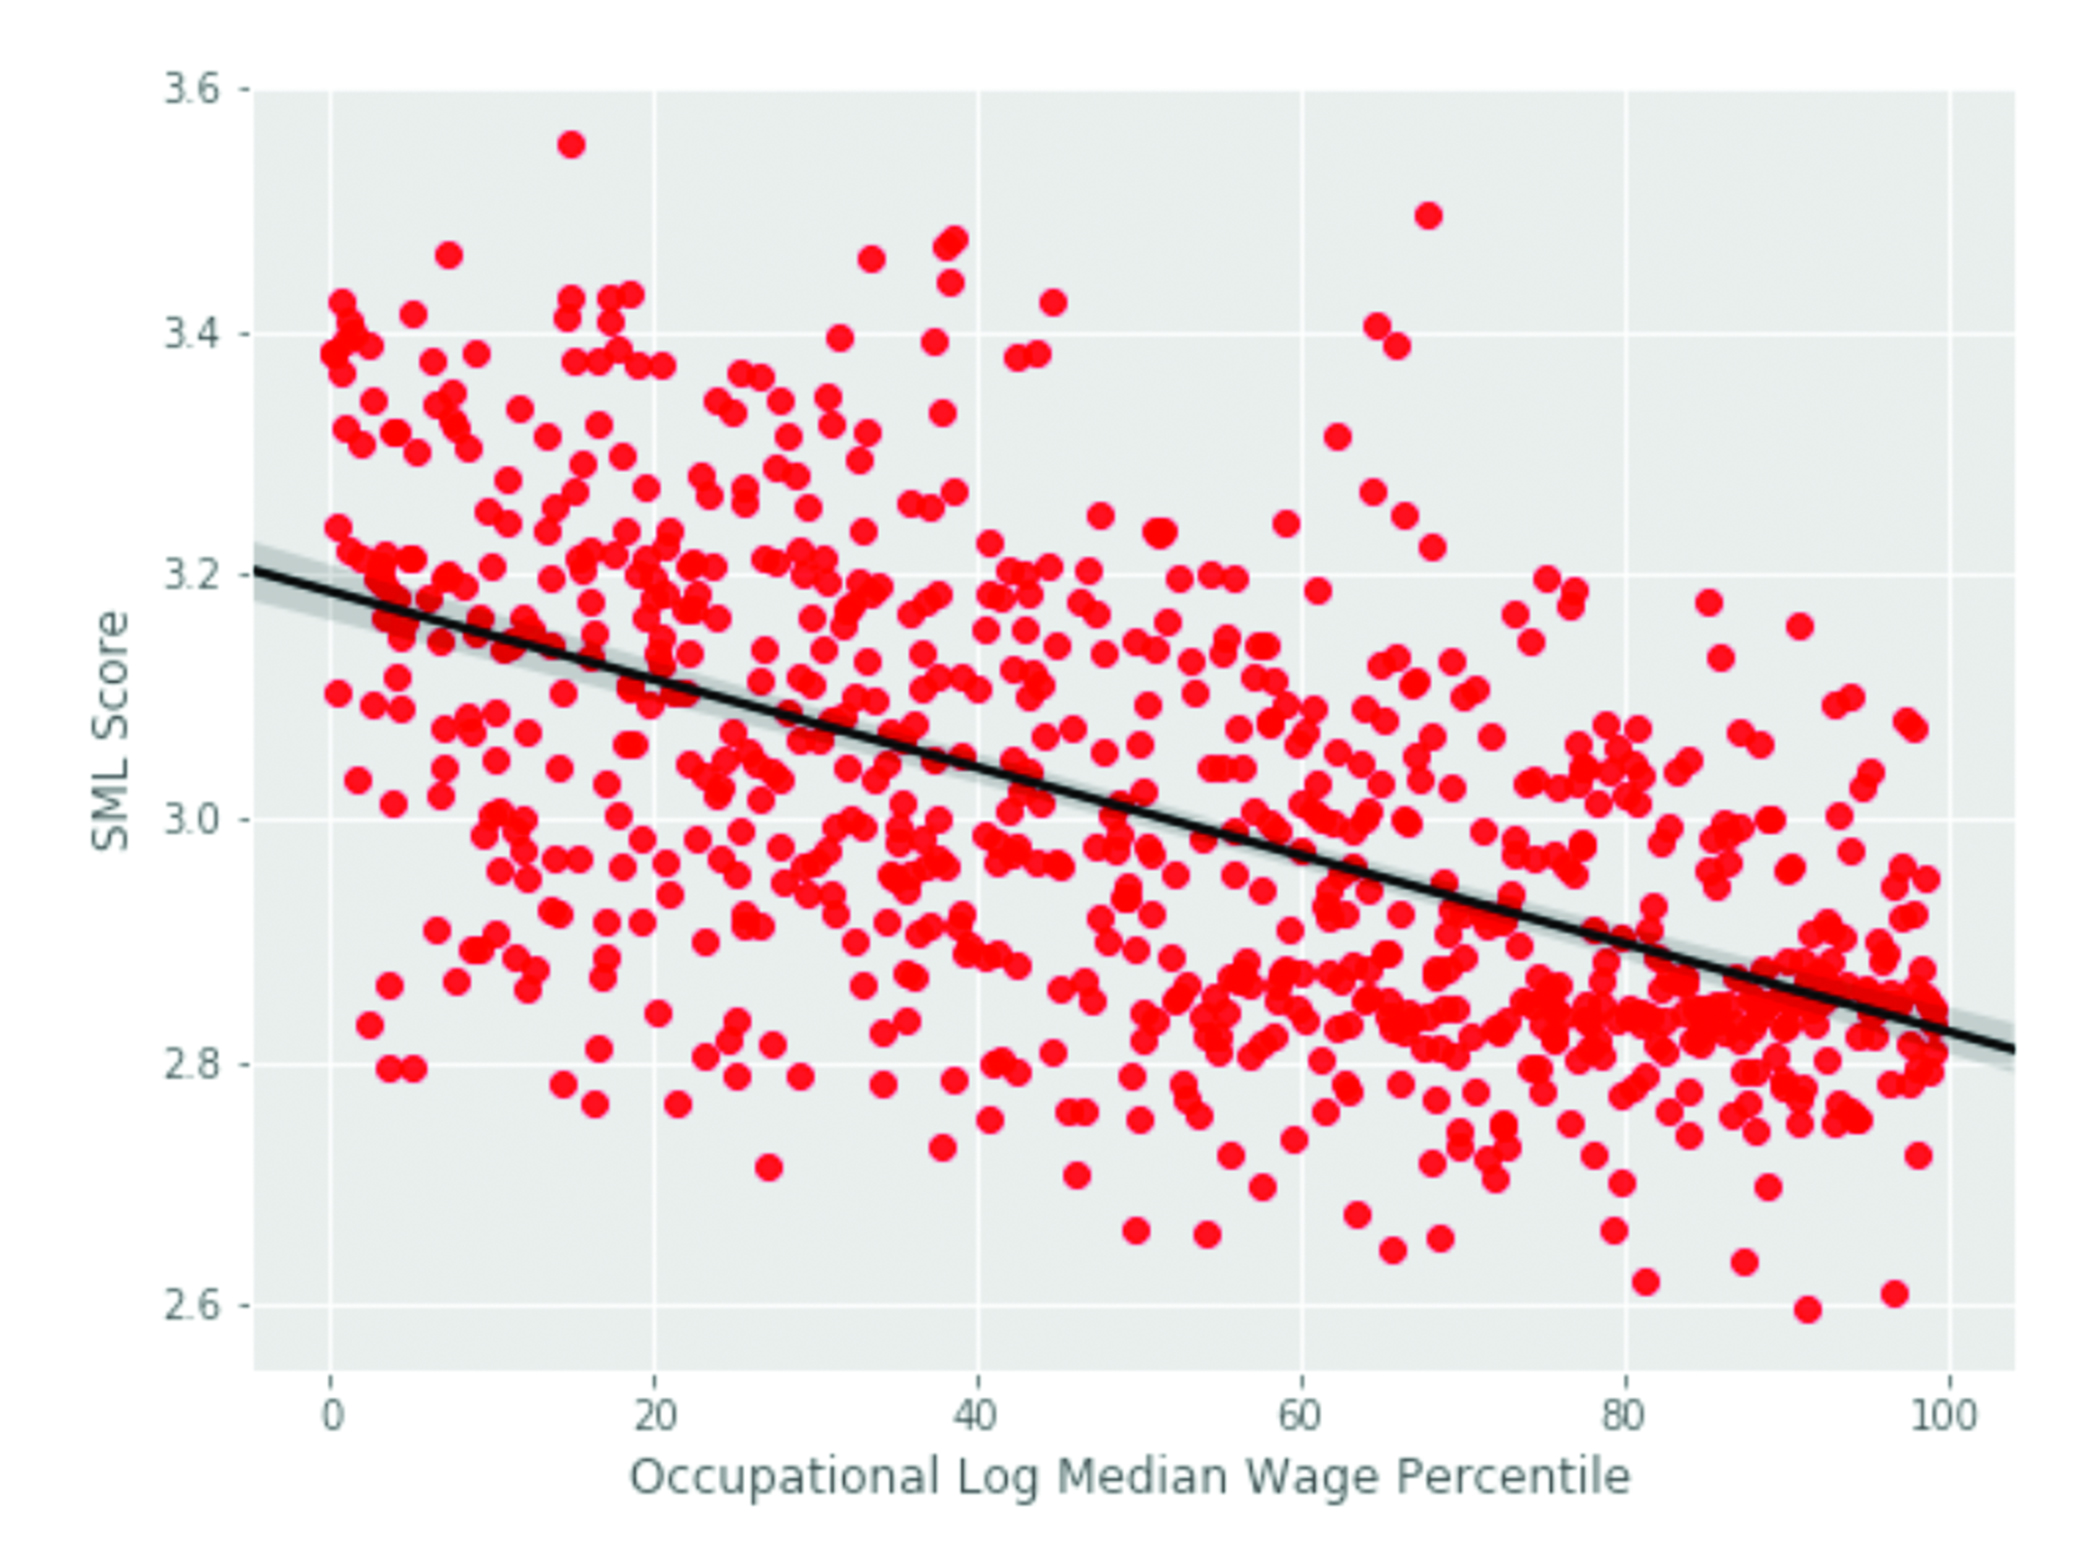
Figure 4A. Standardized SML Score by Region
Source for Figure 3: Brynjolfsson, Mitchell, and Rock (2018a); Rock (2019)
Figure 4B. Standardized Image Data Score by Region
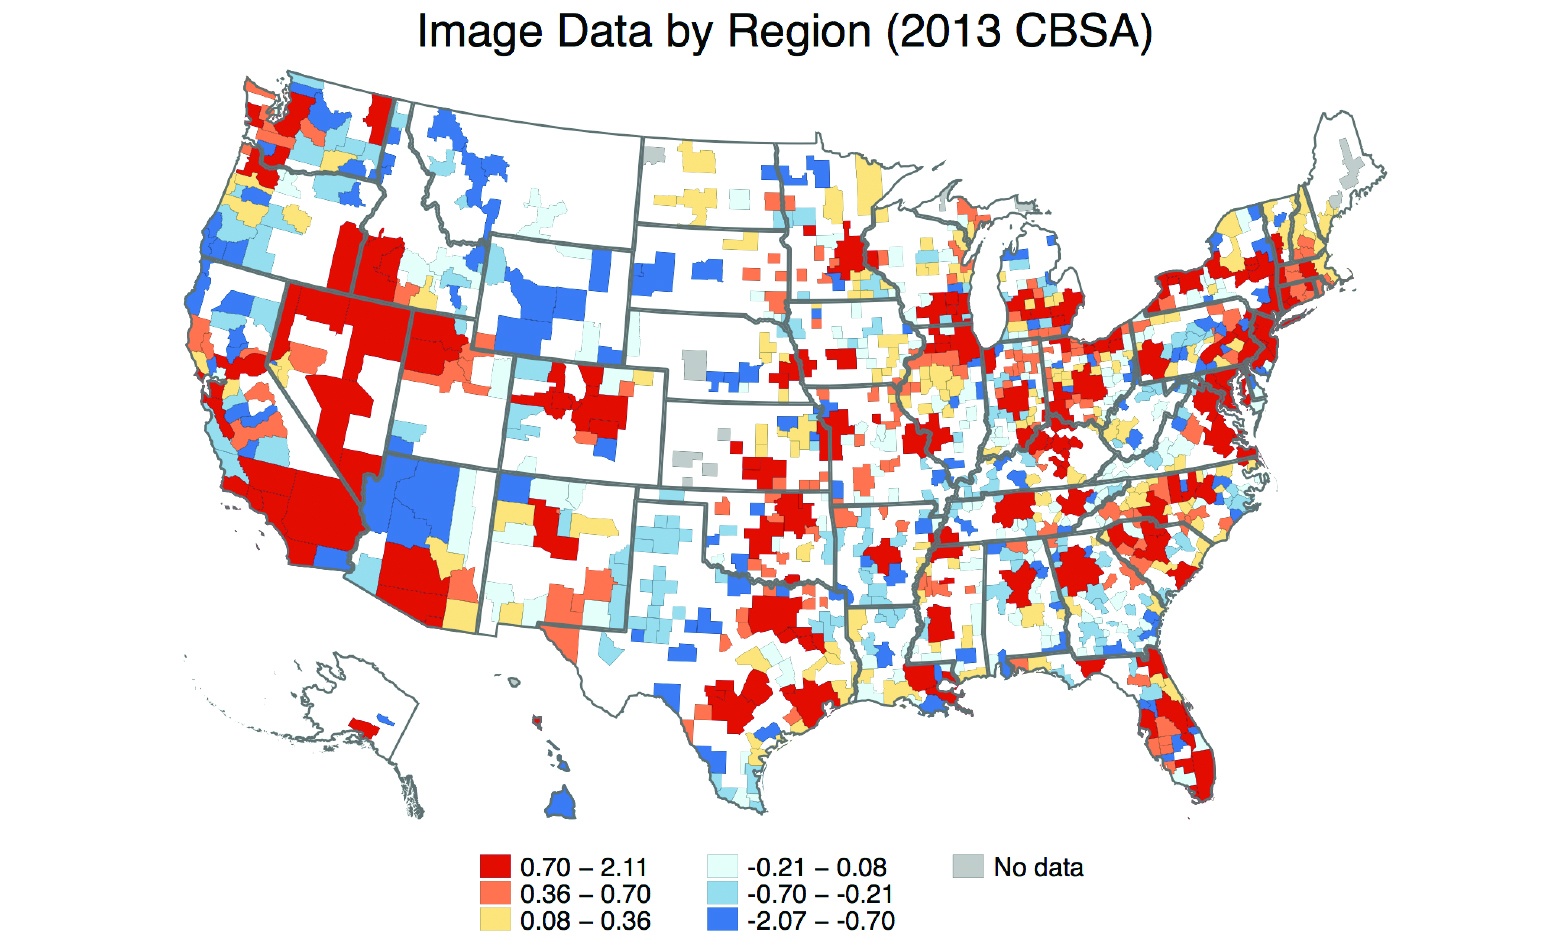
Figure 5. Employment-Weighted Average SML by 2-Digit NAICS Industry
Source for Figures 3-5: Brynjolfsson, Mitchell, and Rock (2018a); Rock (2019)
Figure 6. Change in Quantities of ITIC and PPE for Publicly Traded Firms from 1987 to 2016
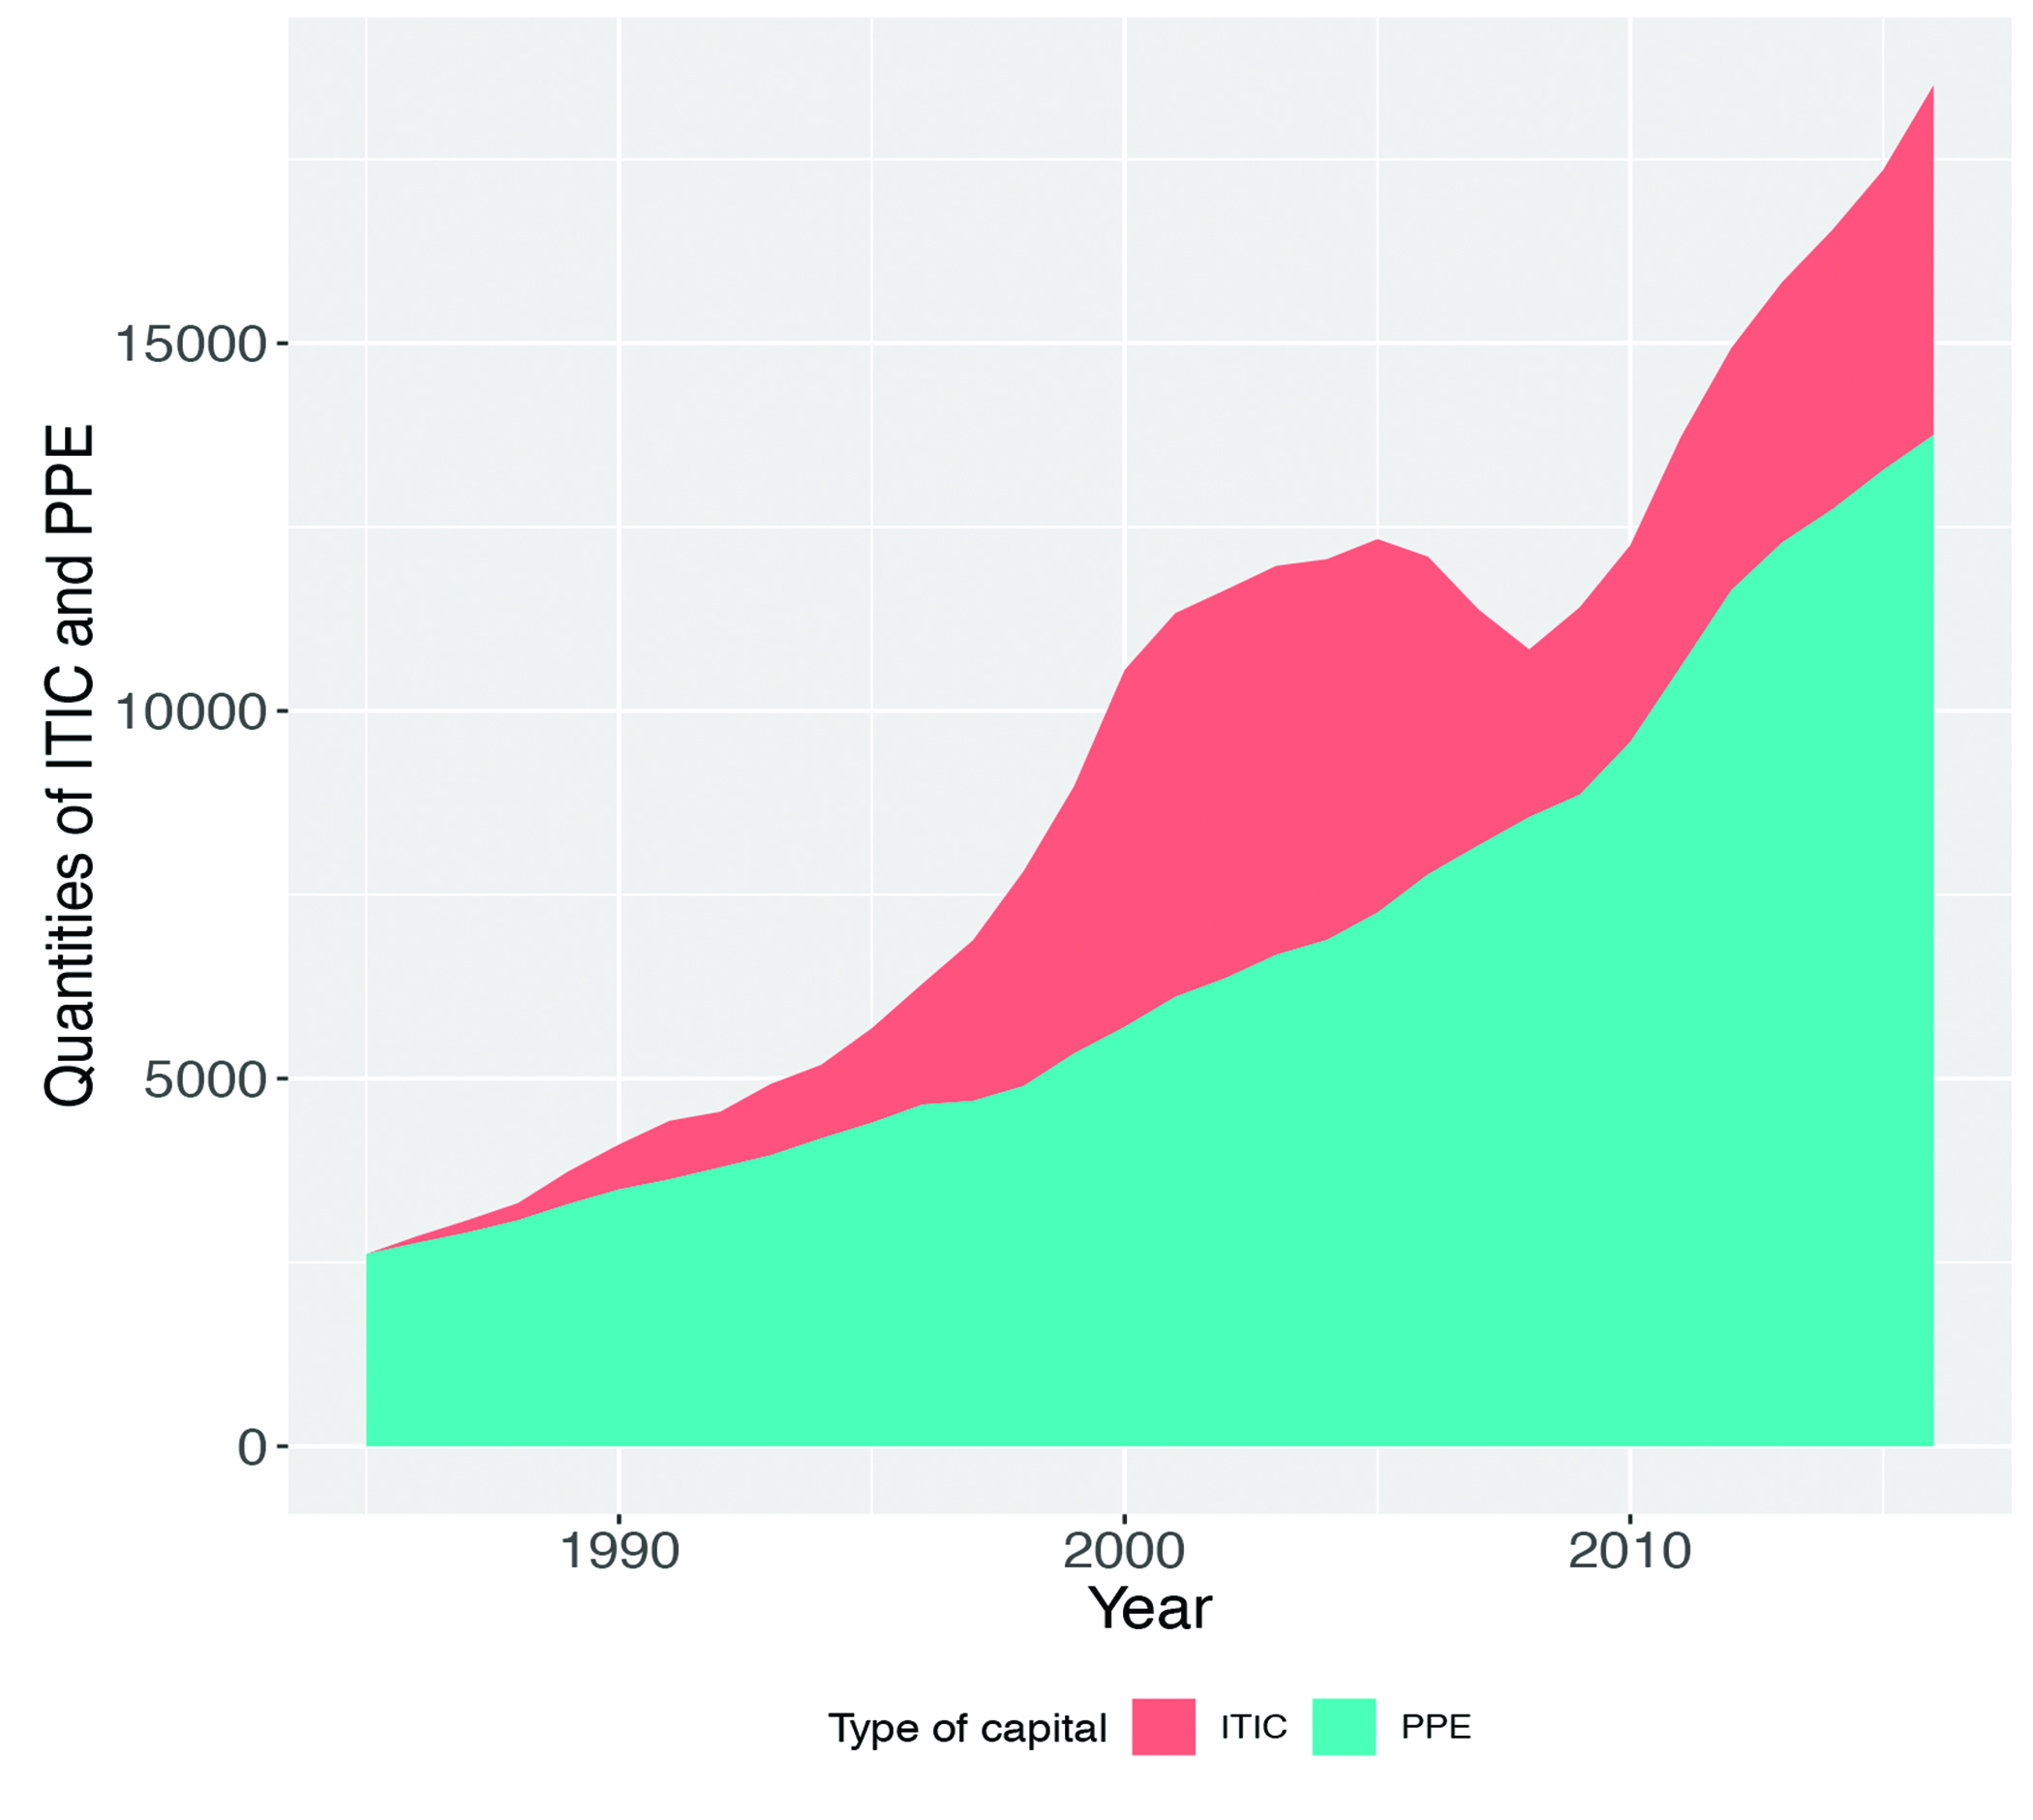
Figure 7. Quantities of ITIC by Firm Quartile
Acknowledgements
This work was done in conjunction with the MIT Work of the Future Task Force. We received access to LinkedIn data as participants in the LinkedIn Economic Graph Challenge. We thank the MIT Initiative on the Digital Economy for generous funding.
Bibliography
Acemoglu, Daron, and David Autor. 2011. Skills, Tasks and Technologies: Implications for Employment and Earnings. Handbook of Labor Economics. Vol. 4.
Acemoglu, Daron, and Pascual Restrepo. 2018. “The Race between Machine and Man: Implications of Technology for Growth, Factor Shares and Employment.” American Economic Review.
Autor, David, Frank Levy, and Richard J. Murnane. 2003. “The Skill Content of Recent Technological Change: An Empirical Exploration.” The Quarterly Journal of Economics 118 (4):1279–1333.
Bresnahan, Timothy F, Erik Brynjolfsson, and Lorin M Hitt. 2002. “Information Technology, Workplace Organization, and the Demand for Skilled Labor: Firm-Level Evidence.” The Quarterly Journal of Economics 117 (1). MIT Press:339–76.
Brynjolfsson, Erik, Morgan R. Frank, Tom Mitchell, Iyad Rahwan, and Daniel Rock. 2019. “Machine Learning, Labor Demand, and the Reorganization of Work.”
Brynjolfsson, Erik, Lorin M. Hitt, and Shinkyu Yang. 2002. “Intangible Assets: Computers and Organizational Capital.” Brookings Papers on Economic Activity 2002 (1):137–98.
Brynjolfsson, Erik, and Lorin M Hitt. 2000. “Beyond Computation: Information Technology, Organizational Transformation and Business Performance.” Journal of Economic Perspectives 14 (4):23–48.
Brynjolfsson, Erik, and Tom Mitchell. 2017. “What Can Machine Learning Do? Workforce Implications.” Science 358 (6370):1530–34.
Brynjolfsson, Erik, Tom Mitchell, and Daniel Rock. 2018a. “Machine Learning and Occupational Change.” Unpublished Working Paper. MIT.
———. 2018b. “What Can Machines Learn, and What Does It Mean for Occupations and the Economy?” AEA Papers and Proceedings, 43–47.
Brynjolfsson, Erik, Daniel Rock, and Chad Syverson. 2018. “Artificial Intelligence and the Modern Productivity Paradox: A Clash of Expectations and Statistics.” In Economics of Artificial Intelligence. University of Chicago Press.
Decker, Ryan A, John Haltiwanger, Ron S Jarmin, and Javier Miranda. 2016. “Declining Business Dynamism: What We Know and the Way Forward.” American Economic Review 106 (5):203–7.
Greenwood, Jeremy, and Mehmet Yorukoglu. 1997. “1974.” In Carnegie-Rochester Conference Series on Public Policy, 46:49–95.
Hall, Bronwyn H. 1993. “The Stock Market’s Valuation of R&D Investment during the 1980’s.” The American Economic Review 83 (2):259–64.
Hall, Robert E. 2001. “The Stock Market and Capital Accumulation.” The American Economic Review 91 (5):1185–1202.
McAfee, Andrew, and Erik Brynjolfsson. 2017. Machine, Platform, Crowd : Harnessing Our Digital Future. Harnessing Our Digital Future.
Rock, Daniel. 2019a. “Engineering Value: The Returns to Technological Talent and Investments in Artificial Intelligence.”
———. 2019b. “Essays on Information Technology, Intangible Capital, and the Economics of Artificial Intelligence.” Massachusetts Institute of Technology.
Shoham, Yoav, Raymond Perrault, Eric Brynjolfsson, Jack Clark, James Manyika, Juan Carlos Niebles, Terah Lyons, John Etchemendy, and Z Bauer. 2018. “The AI Index 2018 Annual Report.” Stanford.
Tambe, Prasanna. 2014. “Big Data Investment, Skills, and Firm Value.” Management Science 60 (6):1452–69.
 is the marginal adjustment cost for the firm at the rate of investment (investment at time t divided by capital stock in the previous period).